1
2 marks
Study Figure 2
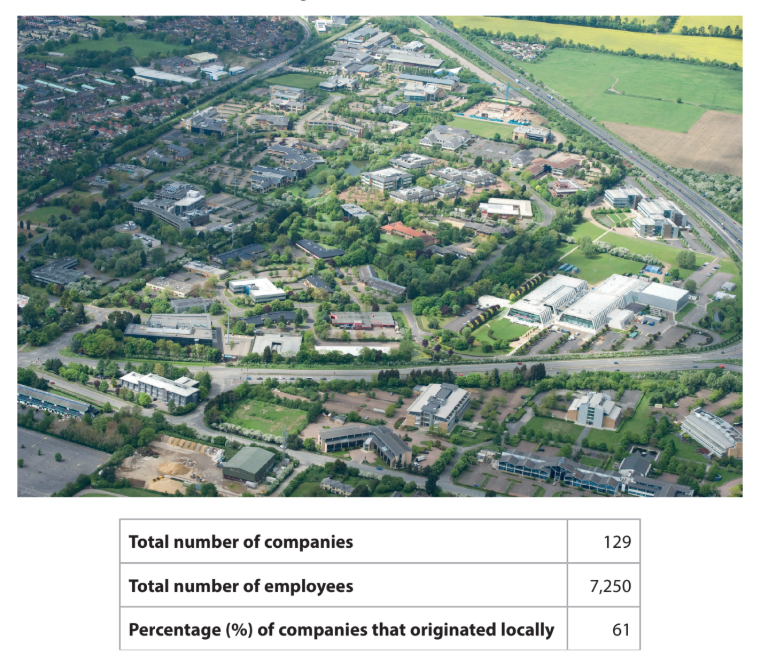
Figure 2
Cambridge Science Park, developed jointly by the local authority and university
Calculate the mean number of employees per company.
You must show your working.
Give your answer to one decimal place.
Answer ...............................
Was this exam question helpful?