Pre-release materials 2026: Introduction UK Water Challenge (AQA GCSE Geography): Revision Note
Exam code: 8035

Pre-release materials 2026: Introduction
The AQA pre-release materials are now available to schools
AQA copyright and exam regulations mean that the resources themselves cannot be shared online – you will receive or may already have received the booklet from your teacher at school
These notes can be used alongside the pre-release booklet to support you in preparing for Paper 3
The issue evaluation is synoptic, which means that it covers more than one topic from the specification
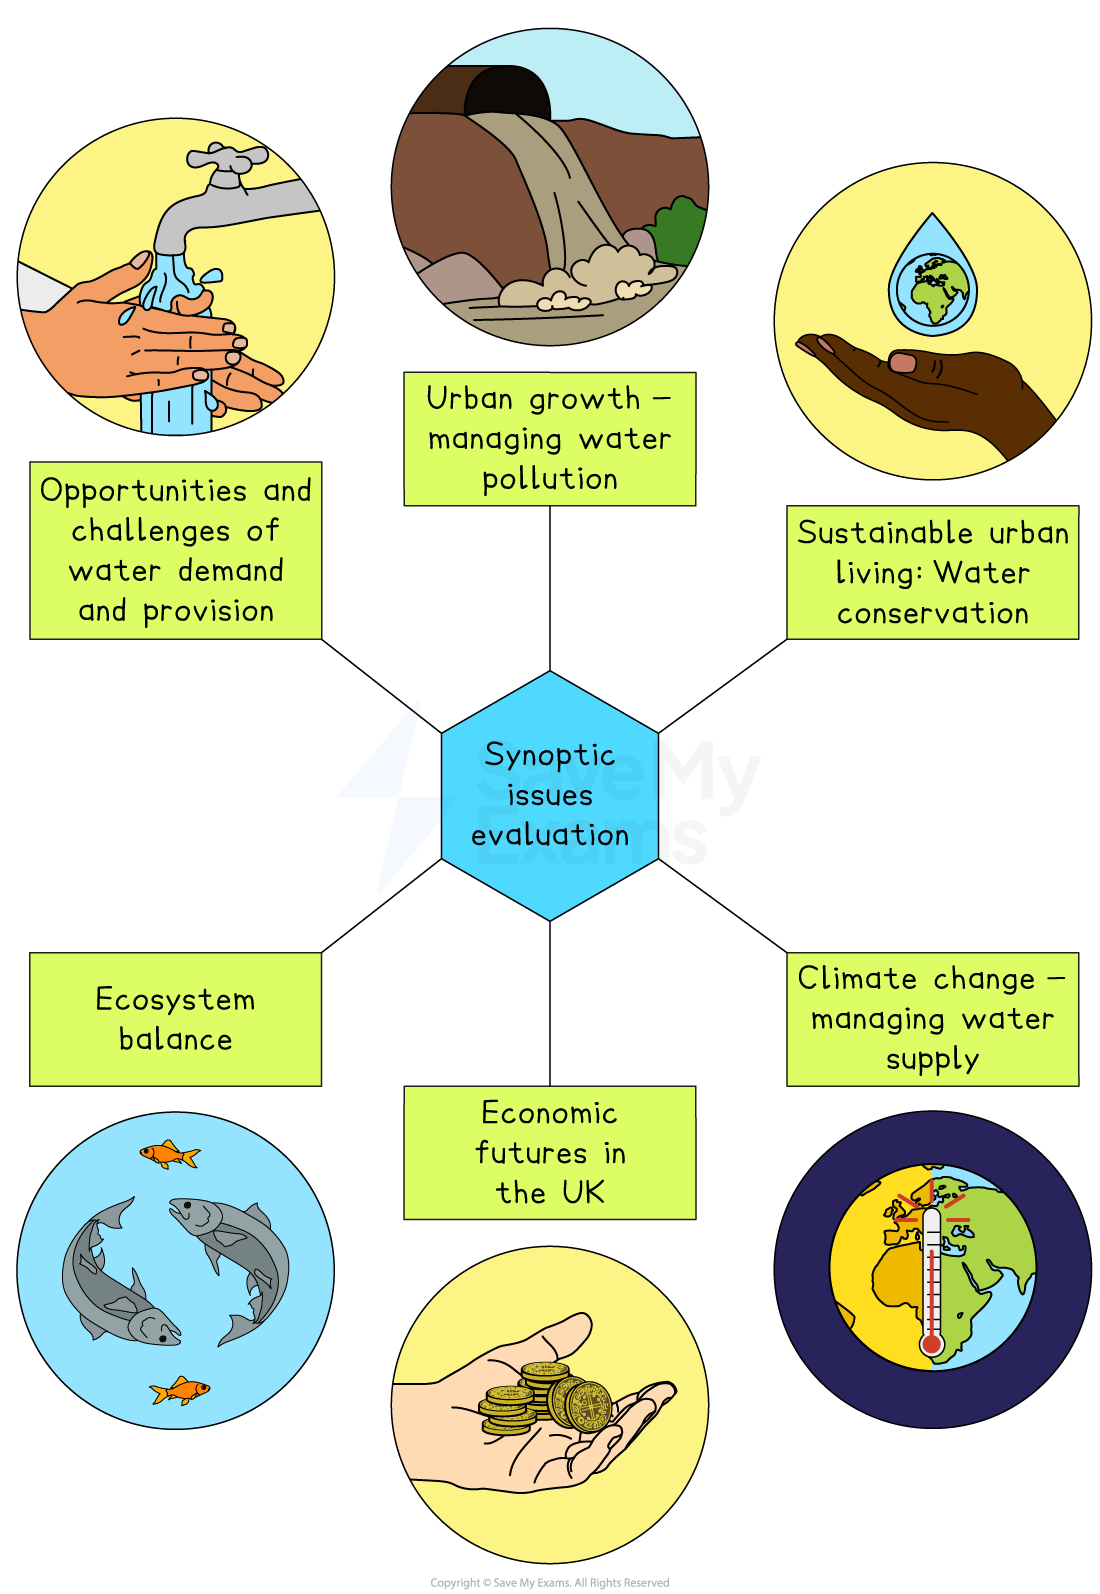
The topics covered in the 2026 issue evaluation are:
The materials below will provide all the background information on the issue and key exam tips needed to tackle the questions in the 2026 Geography Paper 3 successfully
The materials will support you to:
Set the issue in context, including where it is and the key facts about the location
Examine conflicting stakeholder viewpoints regarding the issue
Make an appraisal of the advantages and disadvantages
Evaluate any alternatives
In the exam, you will need to answer various questions about the proposal for a new reservoir in Sleaford, Lincolnshire, East England
You will have about 35-40 minutes for this section of the exam
There will be a series of short skills questions (2-3 marks), followed by 6-mark extended questions and then a final 9-mark question which asks you to decide on the issue
In the 9-mark question, you will be asked whether you agree or disagree with a statement, and then you will be expected to explain your answer.
It does not matter whether you agree or disagree; what matters is how you justify your answer using evidence from the materials in the resource booklet and your knowledge
The issue evaluation skills guide is also here to help you
It provides support with interpreting and using the sources that you have available in the booklet
Examiner Tips and Tricks
The resources below give you context for all the information contained in Figure 1 in the pre-release document.
To avoid copyright infringement of the AQA pre-release, we have directly sourced all the facts and figures included (the sources are given in brackets). If any of these disagree with the pre-release document, you should use the pre-release figures.
Where does UK water come from?
UK water companies deliver approximately 15 billion litres of water per day (Gov.uk (opens in a new tab), 2025)
This water comes from:
Surface water
Groundwater
Approximately 64% of drinking water in England comes from surface water
In Wales and Scotland, the figures are higher at 93% and 95% (gov.uk)
This water is stored in reservoirs and lakes
In England, about 30% comes from groundwater
In Wales and Scotland, this figure is lower at 6% and 5%
Between 6-8% of the supply comes from mixed or other sources (DEFRA)
Source of water | Number of sources in England and Wales |
|---|---|
Surface water | 1,403 |
Groundwater | 1,049 |
Mixed water sources | 348 |
Total | 2,800 |
(Drinking Water Inspectorate: Drinking Water 2024)
Worked Example
How much of the UK's water supply is from groundwater?
A. 20%
B. 30%
C. 60%
D. 40%
Answer
The correct answer is B - 30%
Why does the UK have a water shortage?
The UK often seems to have a lot of rainfall
This means the idea of a water shortage or deficit seems odd
It is important to recognise that the UK has areas of water surplus but also areas of water deficit
The areas of water deficit are becoming more widespread due to increased demand and reduced supply
Increased demand
The increases in demand in the UK are the result of:
Population growth
People are showering and washing clothes more frequently
Farming systems such as greenhouses need more water for irrigation
More use of washing machines, dishwashers, power washers, and hosepipes
Emerging technologies
The average household uses 70% more water today than it did in 1985
Reduced supply
There is also a decreasing supply of water in the UK as a result of:
Warmer, drier summers
Unpredictable winter rainfall
Increased evaporation rates
In June 2025, reservoirs in England were at 76% of their capacity
This is lower than the severe drought level of 2022
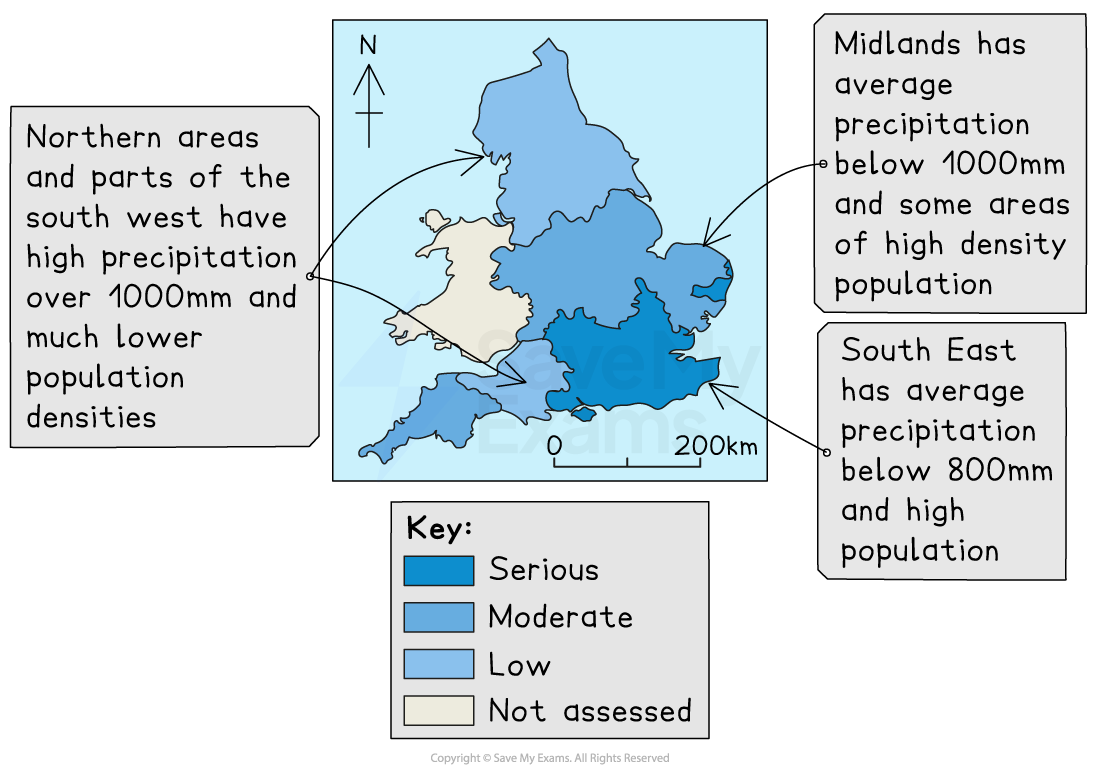
Water surplus and deficit in the UK
Precipitation across the UK is unevenly distributed
The north and west of the UK have a water surplus
Levels of precipitation are higher in the north and east
Population density is lower
The south and east of the UK have a water deficit
Levels of precipitation are lower in the south and east
Population density is higher
Examiner Tips and Tricks
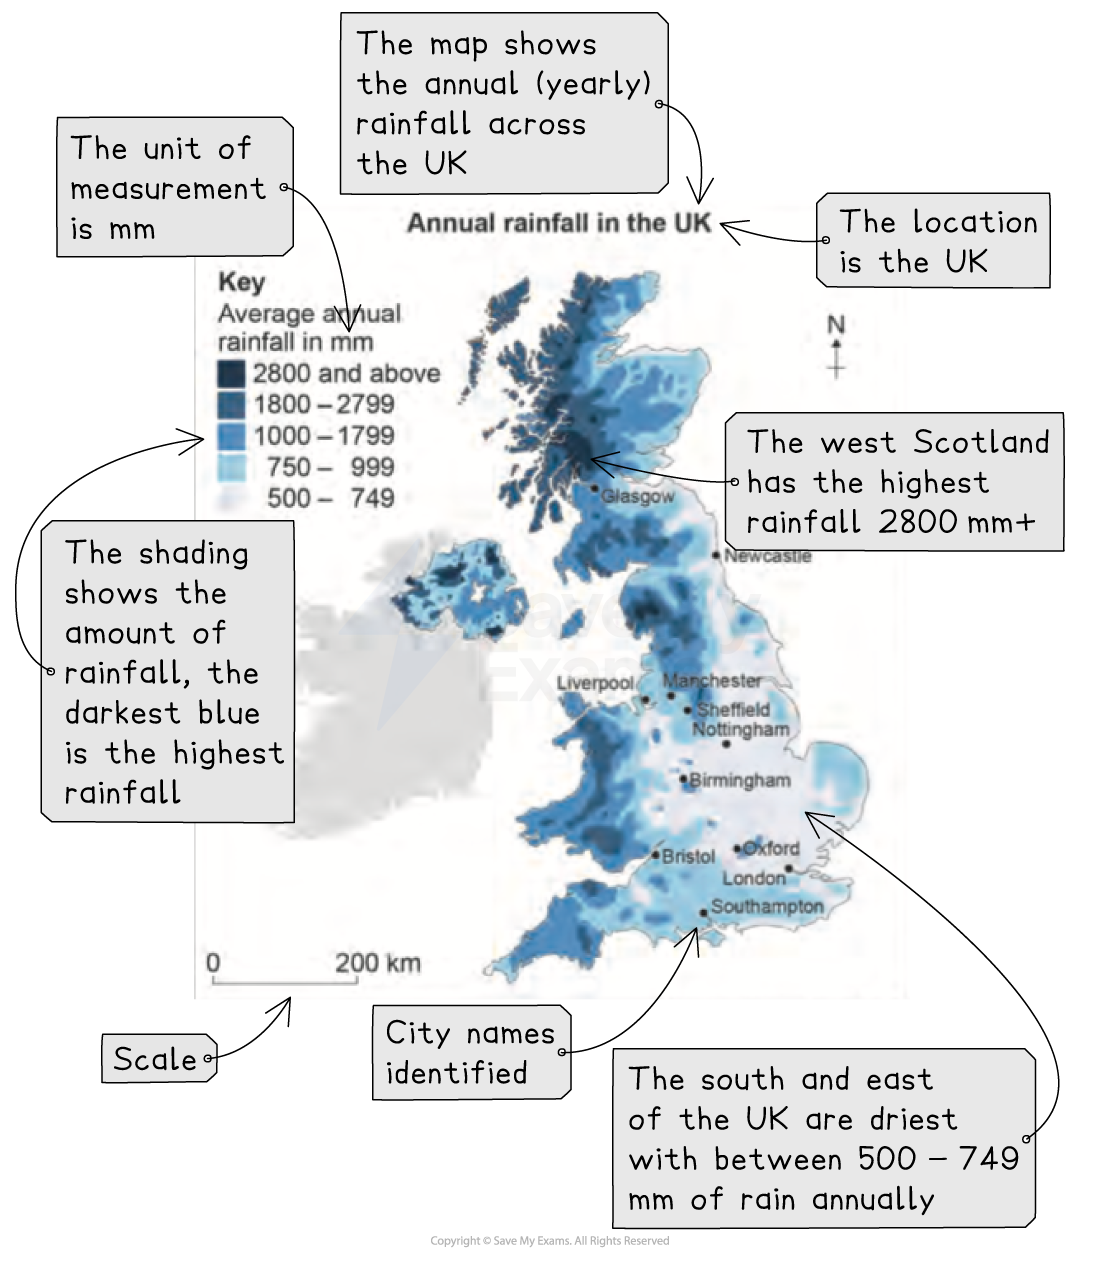
Figure 1 of the pre-release booklet includes a map showing the annual rainfall in the UK. You need to ensure that you are confident in interpreting the map. Use the example above to help you:
What does the map show you? Read the title
What location is the map of?
Read the key to find out what the shading on the map represents.
What is the unit of measurement?
Is there any additional information?
Worked Example
Study the maps showing the UK's population density and the UK's average rainfall.
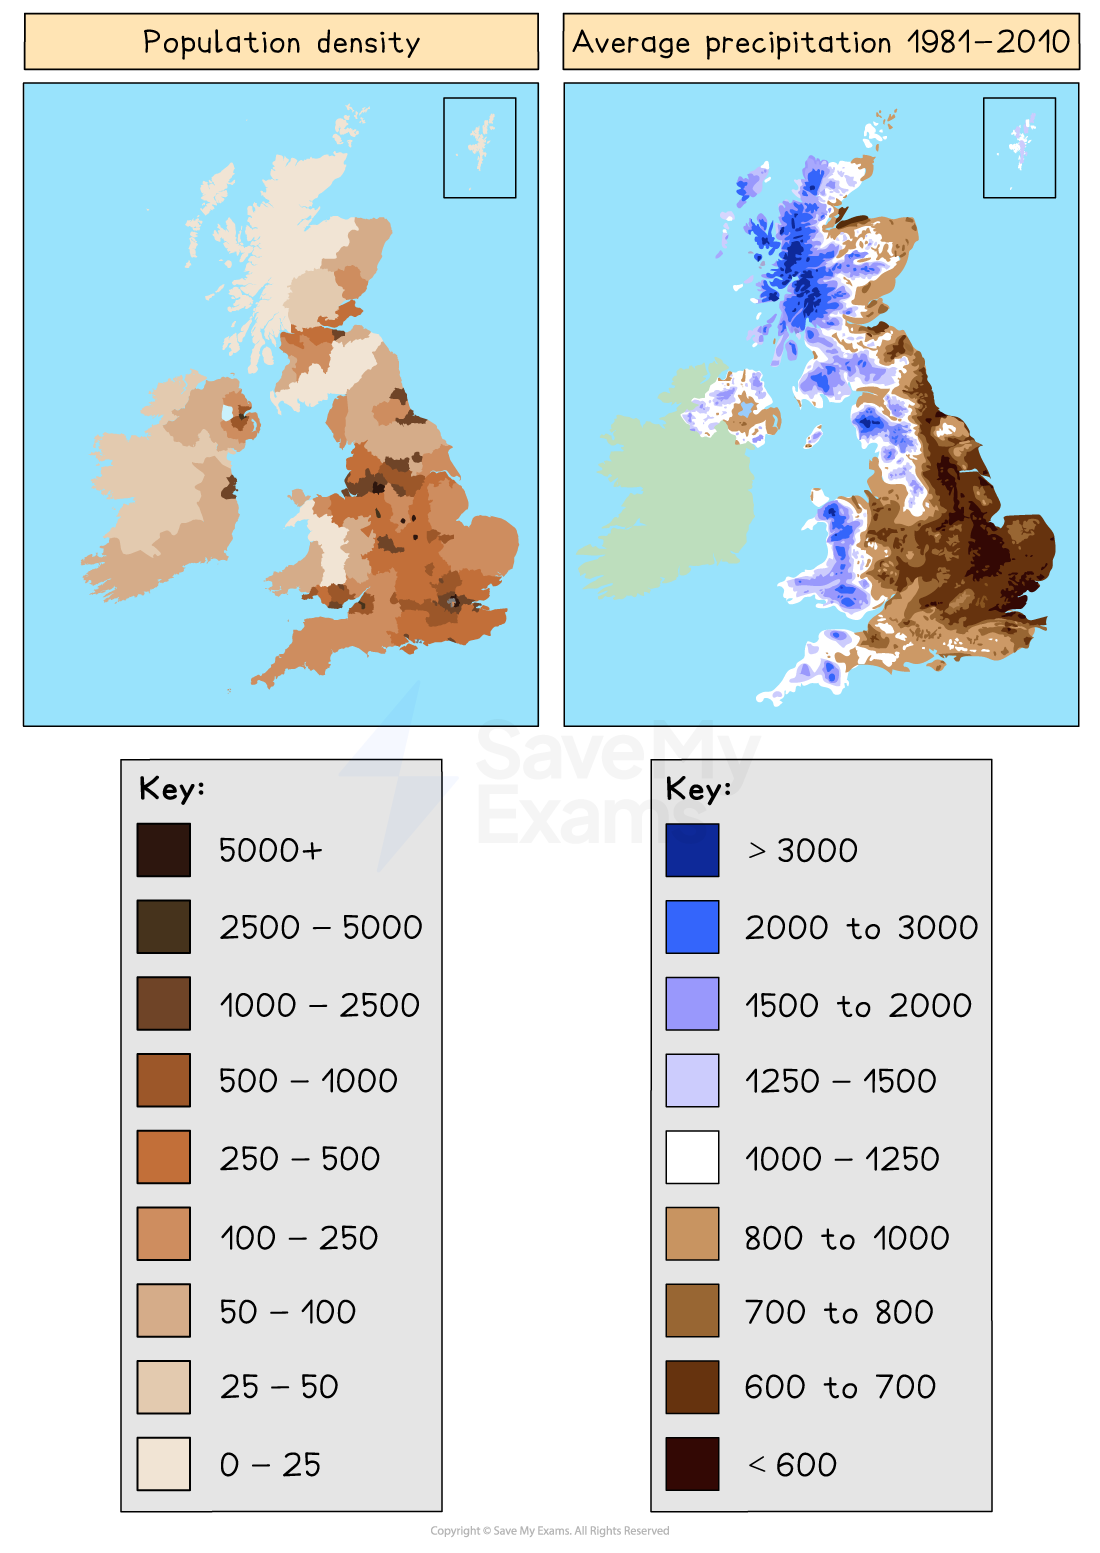
Explain two reasons why the North and West of the UK have a surplus of water.
[4 marks]
Answer
Population density because there are fewer people in the North and West [1], meaning the demand for water is lower [1]
Rainfall levels are higher in the North and West [1], meaning that the supply of water is higher [1]
Effective rainfall
Not all rainfall is available for drinking and other uses
Evaporation and uptake by plants use some of the rainfall
The remaining water available for use is known as effective rainfall
The amount of effective annual rainfall varies across the UK
In Northwest England, it can exceed 2500mm
In some areas of Eastern England, it can be lower than 200mm
Key idea
Different parts of the UK have different levels of water availability
This is due to a combination of different levels of supply and demand
Worked Example
Define the term effective rainfall.
[1 mark]
Answer
Effective rainfall is water that is available for use after evaporation and transpiration. [1]
Water budget graph
Water balance is the difference between the inputs into a system and the outputs
This determines how much water remains as surface water and groundwater
The input into the system is precipitation
The outputs are evaporation and transpiration
Combined, these are known as evapotranspiration
Seasonal changes in water availability
In winter, higher precipitation and lower evapotranspiration often lead to a surplus
Groundwater sources recharge
Uptake of water by plants is low
River discharge is high and rivers may flood
Reservoir and lake stores increase
In summer, lower precipitation and higher evapotranspiration may lead to a deficit
Groundwater stores decrease as the demand for water increases (people use more water in summer)
Soil moisture levels decrease as the uptake by plants increases
River discharge decreases, and smaller rivers may even dry up
Reservoir and lake levels decrease
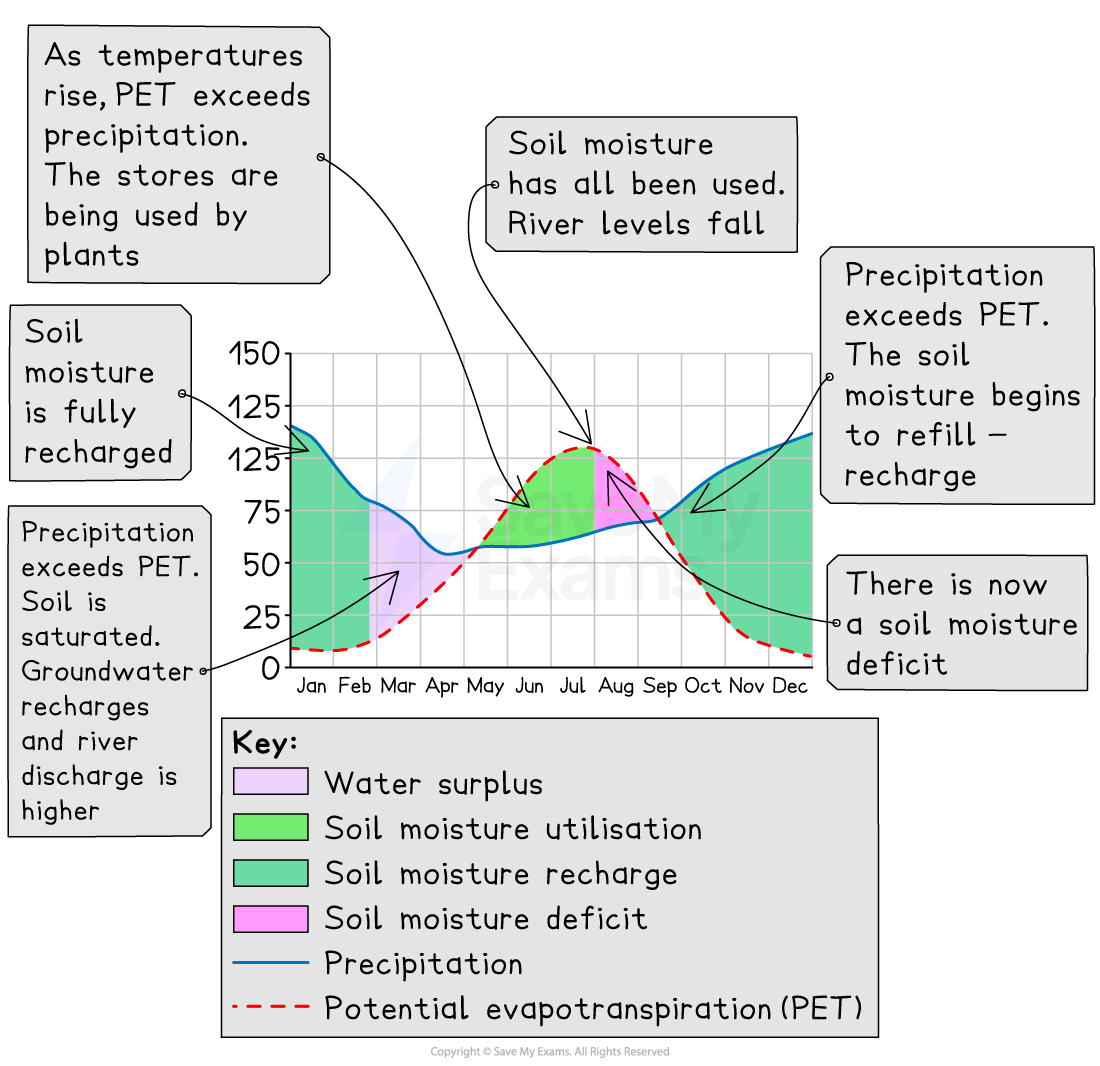
Examiner Tips and Tricks
In the resource booklet, you will find a water balance graph for the UK. You need to understand what information the graph shows. Use the illustration above to add notes to your copy of the graph.
Worked Example
Question 4
Study the water budget graph.
Explain one reason why the region shown experiences a water deficit in summer.
[2 marks]
Answer
One reason the region experiences a water deficit in the summer is that higher temperatures [1] increase the uptake of water by plants and transpiration. [1]
Seasonal changes in water demand
As well as seasonal changes in water supply, there are also seasonal changes in water demand
In winter, demand is lower, and people are not using as much
In summer, demand increases; people are using more water for
drinking
leisure – paddling pools, hot tubs, golf courses
watering gardens
Typically, demand increases by 20% in the summer months
In the hottest, driest periods, such as summer 2022, demand increased 70% in some areas
Key idea
As temperatures rise, the amount of available water decreases, while demand for water increases
This means in some areas of the UK, there will be an increasing water deficit
This has led to water conservation measures such as hosepipe bans and publicity campaigns reminding people of how to conserve water
Water stress in the UK
The seasonal changes and differences in supply and demand can lead to water stress
Water stress is experienced by much of the UK
Different regions experience different levels of water stress
It reflects the levels of water supply and demand in that region
Water stress occurs when the demand for water in a place exceeds the amount of water available, or when the poor quality of water restricts its use
Future UK water needs
It is estimated that by 2050, England will have a 5 billion litre a day deficit of water for public use
A further 1 billion litres will be required for energy, food and industry
This is based on an increased demand of around 4 billion litres a day, combined with a decrease in supply
The increase in demand will vary across regions
Areas with the highest demand are likely to be those where there are:
Most new housing developments
Greatest population increases
It is estimated that the south-east of England alone will need an additional 1 billion litres of water by 2050 to meet the increased demand
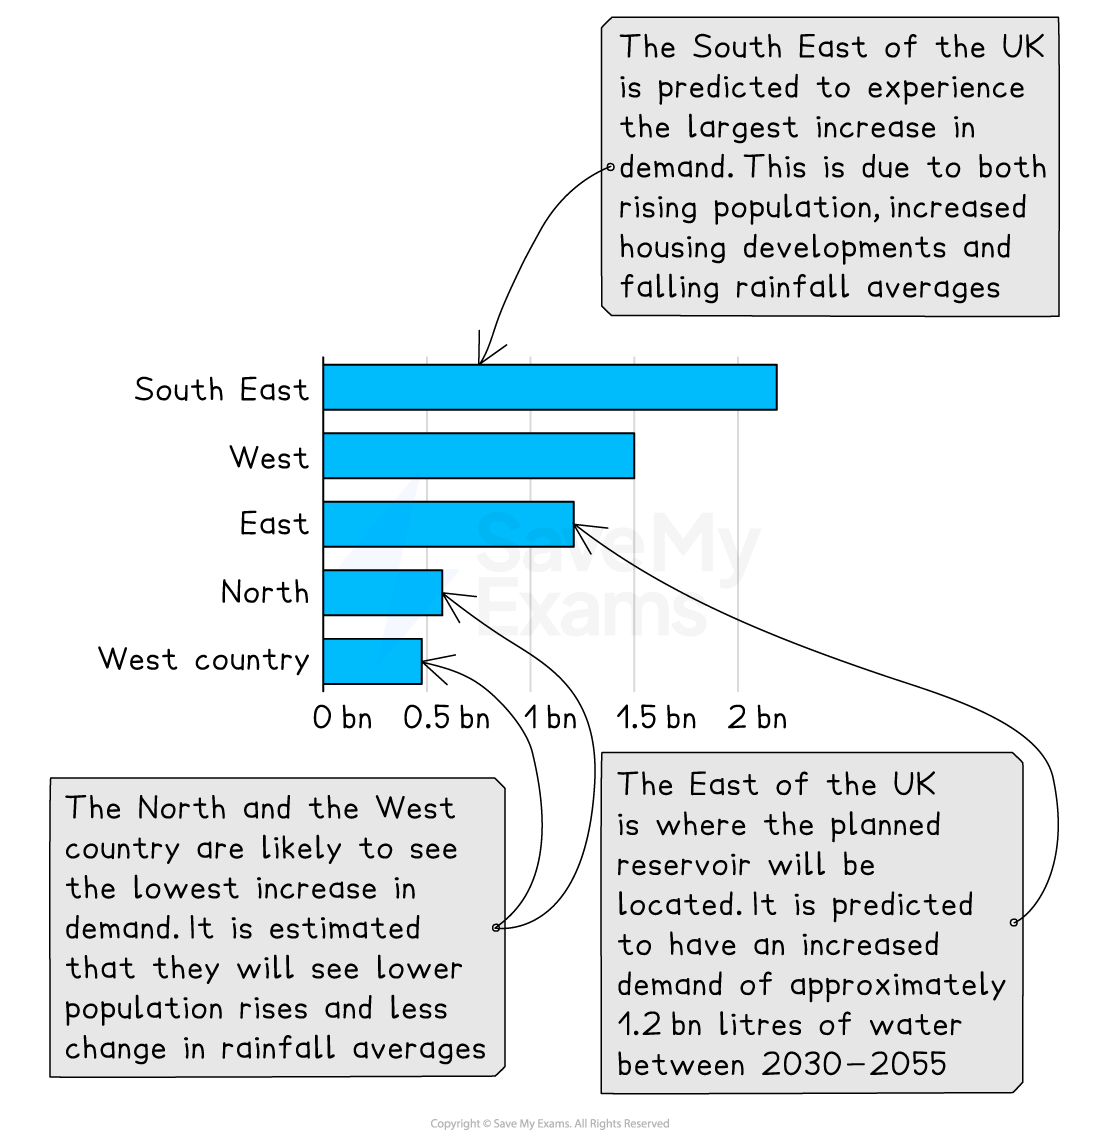
Examiner Tips and Tricks
In the pre-release booklet, you will find a graph showing the predicted increase in water demand in the UK. You need to understand where in the UK will experience the greatest increase in demand and why.
Climate change and water supply
There will also be changes in supply
Some areas will experience more significant changes in rainfall patterns due to climate change
The Environment Agency predicted that:
The amount of water available in England could decrease by up to 10%
Some rivers could see a 80% decrease in water during summer
Climate change may also impact water quality by increasing algal growth
Meeting water needs in the UK
Water companies in the UK are under pressure to meet the needs of increasing water demand
An estimated 27% of groundwater sources are experiencing over-abstraction
This effort includes reducing groundwater use due to environmental concerns about over-abstraction:
Streams drying up
Habitat and biodiversity loss
Reduction of water quality
Saltwater intrusion
In the past, water companies have imposed water restrictions such as hosepipe bans to ensure that water demand can be met
This type of restriction is expected twice as often between 2020 and 2050
The future increase in demand and decrease in supply will require more action to be taken
To meet these needs, the Environment Agency report (Gov.uk, 2025) states that there will need to be:
action to reduce water leaks
better management of demand
construction of 9 new desalination schemes, 10 new reservoirs, new water transfer and water recycling schemes
The National Framework for Water Resources report also highlights the importance of individual action; people should:
reduce water waste and consumption
use water more efficiently
The Environment Agency (EA) made this warning in its five-yearly National Framework for Water Resources report. Public supply would require 5 billion litres, and a further 1 billion would be needed for agriculture and energy users.
The EA said customers in England need to cut their water use by 2.5 billion litres a day by 2055 – down from an average of around 140 litres per person per day to 110 litres per day.
Water scarcity is threatening future economic growth across the UK. In Sussex, Cambridgeshire, Suffolk, and Norfolk, water shortages have already limited housing and business growth.
Alan Lovell, the chair of the EA, told the BBC he would like to see water companies making more use of restrictions like hosepipe bans when there are droughts to "bring home to people that the amount of water they use is making a difference."
BBC, 2025
Examiner Tips and Tricks
In 2025, the Environment Agency released the National Framework for Water Resources report. This report is produced every five years to assess the water supply and demand situation in the UK. Many of the facts and figures in the pre-release are based on this report. You can read a summary on the BBC website. (opens in a new tab)
You need to be able to read the viewpoint in the quotes in the resource and use it to answer questions about people's or organisations' views on water supply and demand.
Water pollution in the UK
The quality of water is as important as the supply of water
The UK has experienced an increase in water pollution incidents
Water pollution incidents are recorded in four categories
Category 1 - major
Category 2 - significant
Category 3 - minor
Category 4 - no impact
In the UK, there has been a steady increase in category 1 and 2 incidents
In 2021, there were 325 incidents
Impact of category 1 and 2 incidents
Category 1 incidents cause serious, extensive or persistent harm, which may include:
A large number of fish deaths and other impacts on ecosystems, including the disruption of food chains
Potential harm to human health
Shut down of abstraction for drinking water
Category 2 incidents cause less extensive harm, but effects may include:
Fish deaths and other impacts on ecosystems
Temporary halt on abstraction for drinking water
Potential harm to human health
Causes of water pollution
The main causes of water pollution in the UK include:
Agriculture
Fertilisers containing nitrates and phosphates
Pesticides
Slurry
Sewage
During periods of heavy rain, water companies are allowed to discharge sewage directly into rivers
Treated sewage, which contains residues of chemicals, is also added to the rivers
Urban runoff
When surface runoff collects pollutants from the urban environment
This may include diesel, salt, pesticides, etc.
Industry
Chemical pollutants and heavy metals may enter rivers from industrial and mining sites
Microplastics and persistent chemicals are also pollutants but are not yet monitored
Worked Example
Question 5
Identify two causes of water pollution.
[2 marks]
Any two from:
Agriculture/fertilisers/pesticides/slurry [1]
Sewage/untreated sewage/treated sewage [1]
Urban runoff/diesel/salt [1]
Industry/toxic chemicals/heavy metals [1]
Glossary
Term | Definition |
|---|---|
Abstraction | The process of removing water from natural sources. |
Aquifer | A natural underground layer of porous, permeable rock, gravel, or sand that stores and allows the movement of groundwater |
Effective rainfall | The water which remains to be used after evaporation and uptake by plants |
Groundwater | Water that is found beneath the Earth's surface. It fills the spaces (pores) between soil, sand, and rock, or within cracks and fractures in the rock itself |
Over-abstraction | The removal of water from natural sources at a faster rate than it is replaced |
Surface water | Any water that sits or flows above the ground, including rivers, lakes, streams, ponds, wetlands, and oceans |
Water balance | The difference between the input (precipitation) and output (evapotranspiration) |
Water deficit | When the demand for water is greater than the supply |
Water stress | When the demand for water in a place exceeds the available amount, or when poor quality restricts its use |
Water surplus | When the supply of water is greater than the demand |

Unlock more, it's free!
Join the 100,000+ Students that ❤️ Save My Exams
the (exam) results speak for themselves:

Was this revision note helpful?
