Weather hazards (WJEC Eduqas GCSE Geography B): Revision Note
Exam code: C112

Specification links
The notes on this page cover part 2.3.3 of the WJEC Eduqas B specification.
2.3.3 - How are weather hazards distributed at a global scale and how does this pattern change over time?
How global circulation creates areas of high and low pressure.
The distribution and location of these pressure systems should be discussed.
Typical weather patterns and the extreme weather hazards associated with high- and low-pressure systems should be discussed.
Coverage should include:
The use of weather charts.
Temporal and spatial changes in extreme weather to include
Seasonal and longer-term changes in the tropics which result in drought (note the link to changing patterns of desertification in 3.4.1)
The seasonal distribution of cyclones/hurricanes.
Global circulation – high and low pressure
Wind formation
To circulate the warm air around the Earth, specific wind and pressure patterns exist
Air always moves from high pressure to lower pressure
This movement of air generates wind
Pressure differences occur because the Earth's surface is heated unevenly
It starts at the equator, which is the hottest part of the Earth
Air rises at the equator, leading to low pressure and rainfall at the surface
Once the rising air hits the edge of the atmosphere, it travels north and south
As the air becomes cold, it begins to sink, creating high pressure and dry air as it descends
The cool air will 'rush' from the high-pressure zone to the low-pressure zone at the equator to be warmed again by the Sun, at the same time creating wind

Pressure differences
Air moves in the atmosphere either towards the ground (subsidence) or up into the atmosphere (convection)
These movements influence air pressure and rainfall
The sea and land heat up differently
Sea:
Forms high pressure in summer and low pressure in winter
It takes longer to heat and cool
Air is denser and cooler in summer but warmer in winter
Land:
Generally, it forms areas of lower pressure in summer and higher pressure in winter
It heats quickly in summer and the air is lighter and rises
It cools quickly in winter
The influence of air movement on weather conditions
Subsidence (sinking air)
This occurs in areas with lower levels of solar radiation, such as the mid-latitudes, the poles or at high altitudes where the air is very cold
Air becomes denser and sinks towards the ground, forming high-pressure areas
As air sinks, it begins to warm and can hold more moisture, preventing clouds from forming
High pressure brings clear skies or very thin clouds
It creates arid or semi-arid conditions due to very little precipitation.
Convection (rising air)
This occurs in areas with higher levels of solar radiation, such as the equator
The ground heats the air above and rises, where it begins to cool and condense into water droplets, which form clouds
Low-pressure areas are created as air moves upward
Thick, heavy cloud cover with heavy rainfall creates wet tropical regions
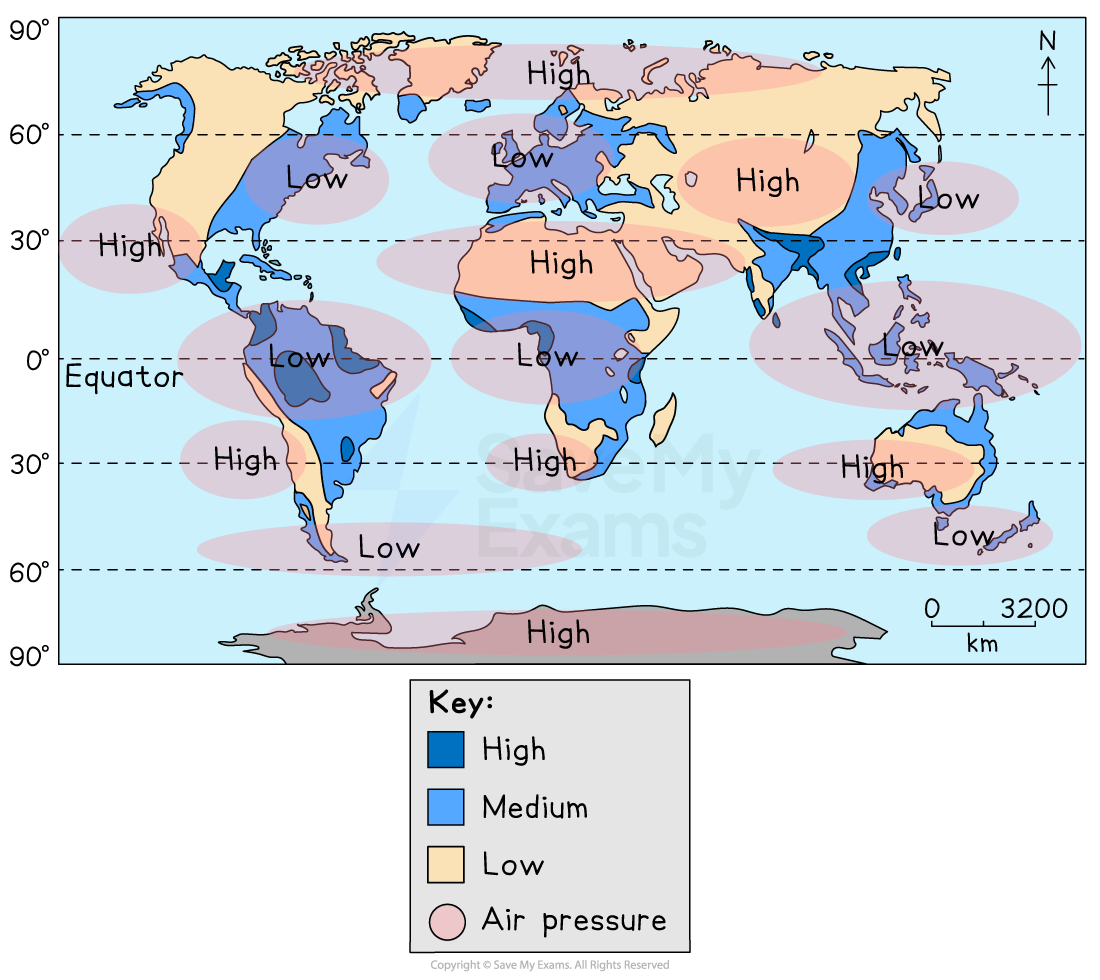
Global pressure belts
The horizontal bands of the Hadley, Ferrel, and Polar cells create a large pattern of high- and low-pressure belts around the Earth
The pattern is not the same in each hemisphere, even though the cells are mirrored
This is because the location of these pressure zones is affected by the amount of land and sea
There is more land in the northern hemisphere and more sea in the southern hemisphere
Coriolis effect
Winds are influenced by the Coriolis effect
The Coriolis effect is the appearance that global winds and ocean currents curve as they move
The combination of pressure cells, the Coriolis effect, and the three cells produces wind belts in each hemisphere
The trade winds blow from the subtropical high-pressure belts (30 ° N and S) towards the Equator's low-pressure zones and are deflected by the Coriolis force
The westerlies blow from the sub-tropical high-pressure belts to the mid-latitude low areas but, again, are deflected by the Coriolis force
The easterlies: Polar easterlies meet the westerlies at 60° S
Weather patterns and extreme weather
Global atmospheric circulation affects the Earth's weather patterns
It causes either a depression or an anticyclone
The UK has a lot of low-pressure weather systems (depressions) that are blown in from the Atlantic Ocean on south-westerly winds, bringing wet and windy weather
These pressure systems bring extreme weather events to many regions of the world and include:
storms/gales
heavy rain
thick fog
heatwave
heavy snowfall
drought
cyclones/hurricanes
Weather fronts
Weather fronts form when different masses of air with varying temperatures and amounts of moisture meet
Fronts are the boundaries between air masses
The area behind the front is known as a 'sector'
Weather fronts are shown on charts using lines and symbols and they point in the direction the front is moving in:
Cold fronts are shown by blue lines with triangles as a steep, rounded face
Cold air is advancing and pushing underneath warmer air
The tips of the triangles indicate the direction of movement of the cold air
Warm fronts are shown by red lines with semicircles as a gradually sloping face
Warm air is advancing and rising up over cold air
The edges of the semicircles indicate the direction of movement of the warm air
Occluded fronts are shown by purple lines with alternating triangles and semicircles
A cold front 'catches up' with a warm front
The cold front lifts the warm air up from the surface, which is then ‘hidden’
An occlusion has the characteristics of both warm and cold fronts
The amount of rain depends on the strength of a front and the temperature difference between the air masses that they separate
As a warm front moves past, a sector of warm air follows behind it, making the temperature rise
The temperature drops when a cold front goes by, as it brings colder air with it
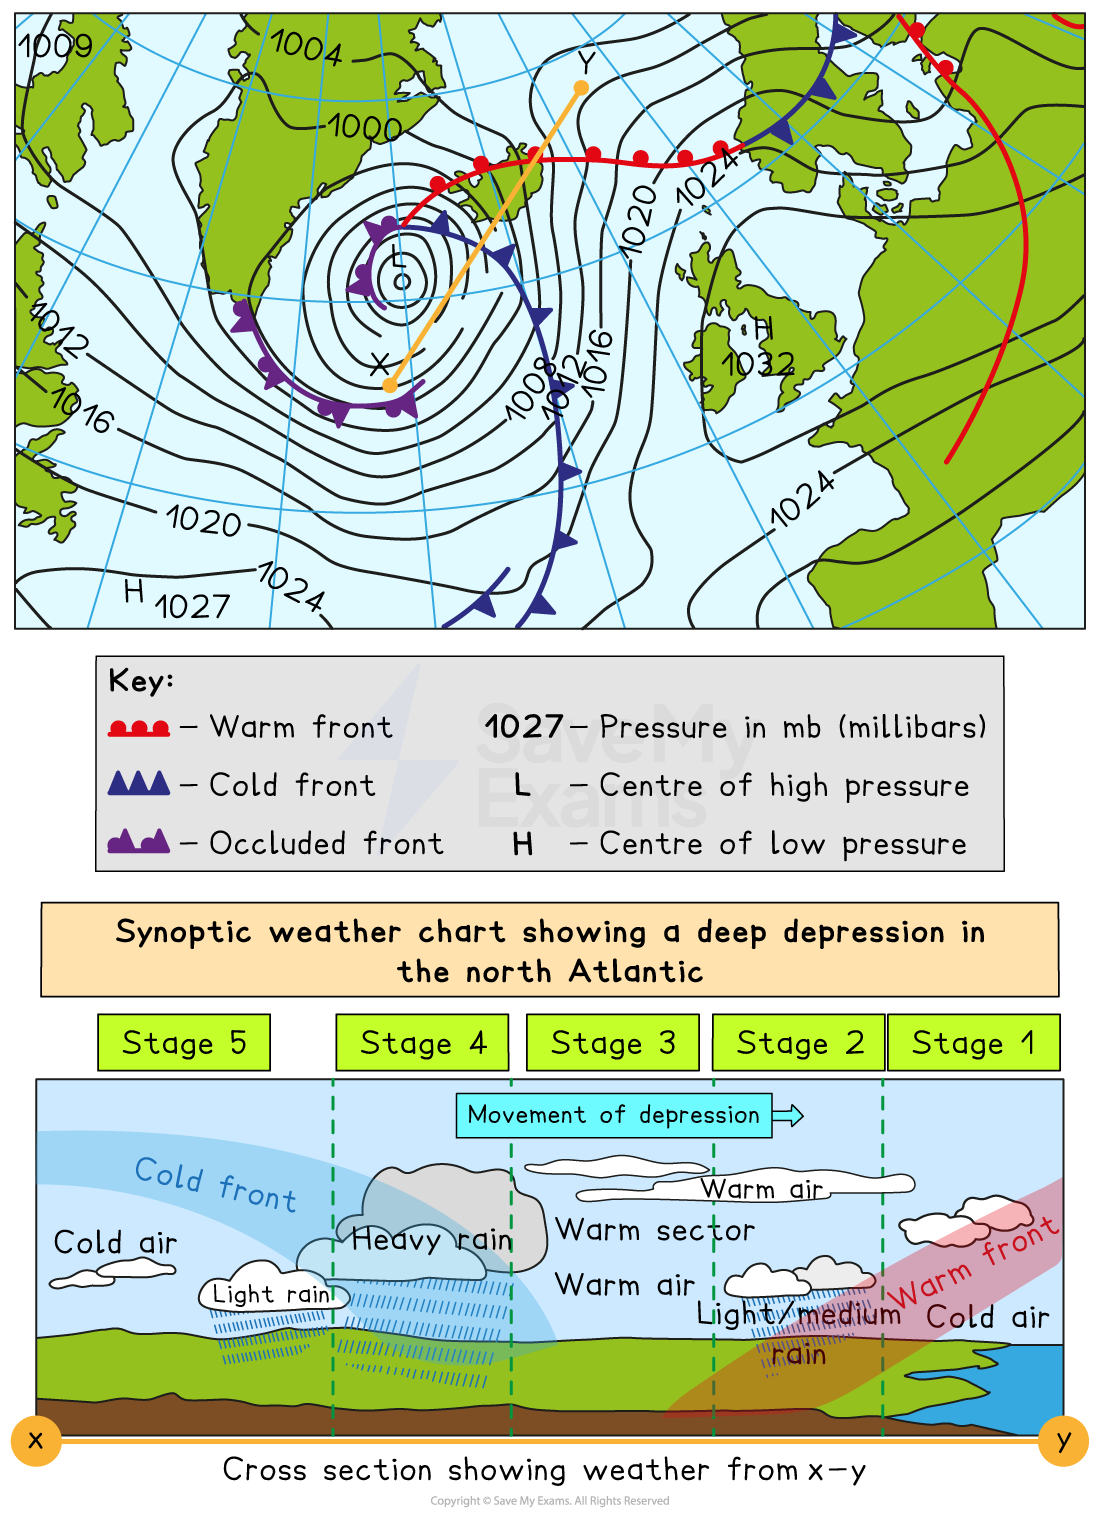
Depression
A depression is an area of low atmospheric pressure (<1004 mb). It is usually characterised by:
Winds spiral towards the centre and are strongest along the cold front
Isobars are close together
It is wettest along the cold front
The lowest rainfall occurs in the warm sector
The temperature is typically warmer in the warm sector behind the warm front and cooler in the cold sector behind the cold front
As a depression travels, the following occur:
Before the warm front arrives
Cloud cover: Increases to thicker, lower clouds
Pressure: Is relatively high before it starts to fall steadily
Temperature: Remains cool or mild
At the warm front
Cloud cover: Continues to thicken
Precipitation: Steady, continuous rain or drizzle begins
Temperature: Starts to rise as the warm air mass moves in
Between the warm and cold fronts
Cloud cover: Scattered or clear with dry weather
Pressure: Reaches its lowest point before beginning to rise again
Temperature: Remains warm
At the cold front
Cloud cover: Develops into tall, heavy clouds
Precipitation: Heavy rain showers and thunderstorms occur as the cold air forces the warm air to rise rapidly
Temperature: Drops noticeably
After the cold front passes
Cloud cover: Breaks up
Pressure: Continues to rise
Temperature: Remains cool
Anticyclone
An anticyclone is an area of high atmospheric pressure (>1008 mb) where air is sinking
As the air sinks, no clouds or rain are formed
The air gets warmer as it sinks, so it can hold more water
Winds spiral outwards from the centre and are usually light with settled, dry and bright conditions
Isobars are far apart
In the summer, anticyclones bring dry, hot weather
In the winter, clear skies bring cold nights and frost
In cold weather, anticyclones can bring fog and mist because the cold causes air moisture to condense at low altitudes
Examiner Tips and Tricks
Wind spirals in different directions depending on which hemisphere it is in and if it is a high- or low-pressure system.
Northern hemisphere
Anticyclone - clockwise
Depression - anticlockwise
Southern hemisphere
Anticyclone - anticlockwise
Depression - clockwise
Weather (synoptic) charts
Meteorological readings are plotted on weather charts
They can show some or all of the following:
wind speed
wind direction
pressure patterns with isobars
weather fronts
cloud cover
temperatures

Simple weather chart Anticyclones (high-pressure systems) can be identified on a synoptic chart due to:
Widely spaced isobars
No fronts/clouds
Isobars show pressure increasing (above 1008mb) outwards from the centre
Depressions (low-pressure systems) can be identified on a synoptic chart due to:
Closely spaced isobars
Fronts/clouds
Isobars show pressure decreasing (below 1004mb) towards the centre
Worked Example
Identify the correct answer in each box.
[4 marks]
Features of a typical depression | Identify the correct answer |
|---|---|
Where are the winds strongest? | warm front / warm sector / cold front |
Where is the air warmest? | warm front / warm sector / cold front |
Where does the heaviest rain occur? | warm front / warm sector / cold front |
Where is rainfall the lowest? | warm front / warm sector / cold front |
Answer
The winds are strongest at the cold front. [1 mark]
The air is warmest in the warm sector. [1 mark]
The heaviest rain occurs on the cold front. [1 mark]
The lowest rainfall is in the warm sector. [1 mark]
Temporal and spatial changes in extreme weather
Extreme weather is changing over time and space
Many events are happening more often and with more force
There is a trend towards heavier rain, hotter heatwaves, and longer dry spells around the world
However, the effects are different depending on location and the time of year
For example, depending on latitude and longitude, some places have wetter winters and drier summers, while others are seeing damaging winds and heavy flooding
Temporal changes (changes over time)
Studies show there is an increased frequency and intensity of high- and low-pressure systems bringing heavy rain and flooding or heatwaves over time
In some places, the number of dry days in a row has decreased, but the length of the dry spell has been increasing, resulting in droughts
Overall rainfall totals do not show a clear change, but some places are seeing wetter winters and drier summers
Spatial changes (changes across locations)
Latitude influences the type and severity of extreme weather events in a given area
For example, people living nearer to the Equator often suffer from life-threatening conditions such as tropical cyclones and droughts
Tropical cyclones:
Hurricanes, typhoons, and cyclones form between 5° and 30° latitude north and south of the equator, where warm ocean water (above 27°C) provides the necessary energy
Tropical storms are rotating, intense low-pressure systems (below 950mb)
They are known as:
Typhoons in the South China Sea and the western Pacific Ocean
Hurricanes in the Gulf of Mexico, the Caribbean Sea and the west coast of Mexico
Cyclones in the Bay of Bengal, the Indian Ocean and northern Australia
While the total number of storms may not increase, warmer sea surface temperatures are intensifying them, leading to more powerful and damaging events
Cyclones are seasonal events that occur between June and October in the northern hemisphere and December and March in the southern hemisphere

Temperature extremes:
Polar regions experience lower-angle solar energy, resulting in colder climates and extreme cold weather events
However, tropical and subtropical zones are prone to more frequent and intense heatwaves, especially in mid-latitude and semi-arid regions
This is due in part to a band of low pressure in the atmosphere known as the tropical rain belt
This belt is where the two hemispheres' trade winds meet and is called the Intertropical Convergence Zone (ITCZ)
Warm, moist air has to rise at the Equator because of this meeting, which causes heavy rain, thunderstorms, and the formation of cloud bands
The ITCZ moves with the seasons because it follows the area of highest solar heating, making tropical areas have distinct wet and dry seasons
Monsoons
In mid-latitude regions, temperatures change over a seasonal cycle, and weather events last just a few days
This might make it cool and rainy one day and warm and sunny the next
However, in tropical latitudes, temperatures don’t change much throughout the year
The tropical season is a shift between dry and wet periods brought about by monsoons
A monsoon is not a storm but a large pattern of winds and rain that covers a geographic area like a continent
The summer monsoon has large amounts of rain
The winter monsoon has dry conditions
During the winter, air descends, causing high pressure
The dry conditions during winter can even lead to drought if they are too intense or too long
Climate change and tropical storms
Global temperatures are set to rise as a result of global warming
More of the world's oceans will be above 27° C; therefore, more places across the world will experience tropical storms
Oceans will stay at 27°C or higher for longer during the year, which will increase the annual number of tropical storms
Higher temperatures will mean storms will be stronger and more frequent and cause more damage
Worked Example
Suggest one way the distribution of tropical storms could change if global ocean temperatures continue to rise.
[1 mark]
Answer
They may affect areas further from the Equator. [1 mark]
They could affect parts of the sub-tropics/the South Atlantic/NE USA. [1 mark]
They could have a broader distribution/effect on larger parts of the world. [1 mark]

Unlock more, it's free!
Join the 100,000+ Students that ❤️ Save My Exams
the (exam) results speak for themselves:

Was this revision note helpful?
