Cartographic skills (WJEC Eduqas GCSE Geography B): Exam Questions

Exam code: C112

17 mins9 questions
1a
1 mark

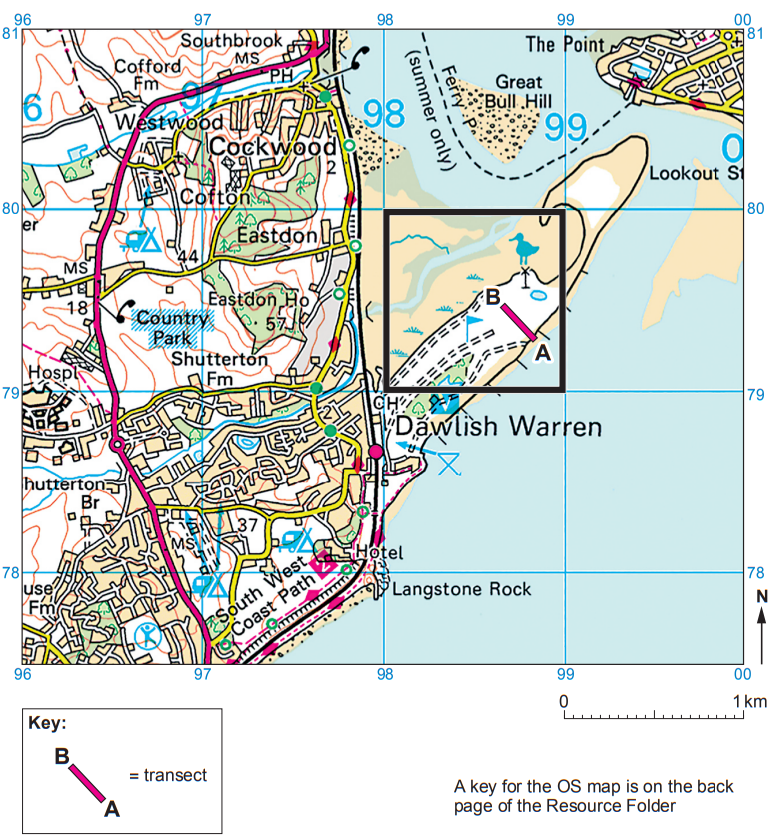
Students investigated air pollution in Luton, Bedfordshire, England.

Study Map 2.2.

Map of central area with ring road outlined in blue, labelled sample site A, nearby landmarks include University and a cemetery at grid section 21.
Map 2.2: An Ordnance Survey map of central Luton

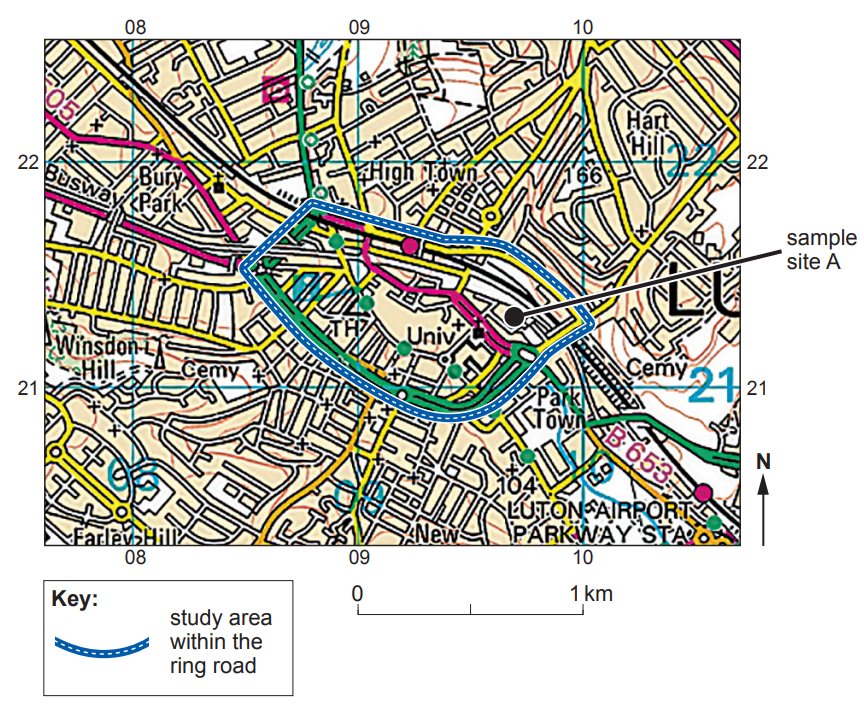
Estimate the size of the study area. Tick (√) one choice .

  • 10 m2

  • 100 m2

  • 1 km2

  • 10 km2

1b
1 mark

Give a 6-figure grid reference for sample site A.

2a
1 mark

Students decided to investigate vegetation changes across a sand dune.

Study Map 1.1. It shows Dawlish Warren sand dunes and town. In grid square 9879 (outlined) it shows the location of a transect (A–B) and sand dunes that students used to collect their data

Ordnance Survey map of Dawlish Warren, featuring landmarks, roads, contour lines, and a highlighted transect from point A to B.
Map 1.1 – Dawlish Warren, a small town on the south coast of England

Tick (√) the correct length of the transect in grid square 9879.

  • 50 m

  • 100 m

  • 250 m

2b
1 mark

Tick (√) the correct direction of the transect in grid square 9879.

  • North East to South West

  • South East to North West

  • West to East

2c
1 mark

Give the 6-figure grid reference of the start of the transect at point A

2d
1 mark

Great Bull Hill is found in grid square 9880 on Map 1.1. It is a bank of sand and shingle . Estimate the area of Great Bull Hill.

3
1 mark

Students decided to investigate the changing rate of erosion on a stretch of local coastline. They collected secondary data including Map 1.1.

Map showing towns along the east coast of England: Flamborough, Hornsea, Mappleton, Withernsea; coastline from 2000 years ago is highlighted.
Map 1.1 – Coastal erosion on the Yorkshire coast

Calculate the distance the coast has eroded between points A and B, as shown on Map 1.1.

4
3 marks

Study the map of net migration in the UK.

Map of the UK showing net internal migration from 2007 to 2012, with positive and negative changes marked by circles of varying sizes.
Map showing net migration to selected towns and cities in the UK

Tick (√) the three correct statements in the table below, using information from the map.

  • There are more towns and cities experiencing positive net migration than negative net migration.

  • There are four towns and cities on the south coast of England experiencing positive net migration.

  • There is a cluster of positive migration in north west England.

  • London’s net migration is less than 100,000.

  • Four towns and cities in Scotland are experiencing negative net migration.

  • Newport is the only city in Wales with negative net migration.

5
1 mark

Many rural areas in the UK have experienced significant amounts of population change in recent years.

Map of UK showing population change by colour: red for 15%+, orange for 10-14.9%, yellow for 5-9.9%, light yellow for 0-4.9%, grey for reduction.
Map 3.1 – Population Change in the UK 2001-2011

Tick (√) two statements that correctly describe the map.

  • All coastal areas have experienced gains in population.

  • There is a large positive growth in much of northern Scotland.

  • There is no population decline in Northern Ireland.

  • Wales has the largest population growth in the UK.

  • The greatest population decline is in the east of England.

6
1 mark

Study the map in the separate Resource Folder. The map shows part of the Isle of Wight.

Map of Freshwater, Isle of Wight, showing roads, footpaths, and landmarks like Tennyson Down and The Needles, with topographical contours.
An OS map of an area of the Isle of Wight

What is the distance along the Tennyson Trail footpath from the Coastguard Cottages at 301848 to the viewpoint at 325853?

.................................... kms.

7
1 mark

Figure 2.1 below shows part of the area on the map. It was taken in grid square 3085.

Coastal landscape with cliffs, sea stacks labelled A, cliffs labelled B, and bay labelled C. Foreground shows greenery under a partly cloudy sky.
Figure 2.1

In which direction was the photograph taken?

Tick (√) the correct box below.

  • North-west

  • North-east

  • South-west

  • South-east

8
3 marks

The UK experienced many floods in 2015. Study Maps 3.1. The maps show river flow rates in the UK in November and December of 2015.

Map of the UK shows river flow levels in November and December 2015 with colour-coded markers from notably low to exceptionally high flow.
Maps 3.1 - Monthly mean river flow rates in November 2015 and December 2015.

Tick (√) three correct statements about Maps 3.1 in the box below.

  • The number of rivers with exceptionally high flow increases between November 2015 and December 2015.

  • In December 2015 there were more than 10 rivers with record high flows.

  • Most rivers in Wales in November 2015 had a below normal flow.

  • The rivers in northern Scotland have the highest flow rates in November 2015.

  • All rivers in eastern England have lower flow rates than western England.

  • The rivers with a normal range of flow are located mainly in southern England.

9
1 mark

Land in the UK can be categorised into different uses as shown in Table 3.2 below.

Table 3.2 - Land use in the UK

Land Use

Area (Thousand hectares)

Percentage

Agricultural

16000

64

Forestry

3000

12

Urban

22

Water

500

2

Complete Table 3.2 by calculating the area (thousand hectares) of urban land use in the UK. Show your working.

Answer .............................. thousand hectares