Practical: Investigating Respiration (SQA National 5 Biology): Revision Note
Exam code: X807 75

Written by: Cara Head
Updated on
Demonstrating the production of carbon dioxide
The process of how living organisms respire can be measured using chemical indicators or sensors
During aerobic respiration, organisms take in oxygen and release carbon dioxide. These gases can be detected using:
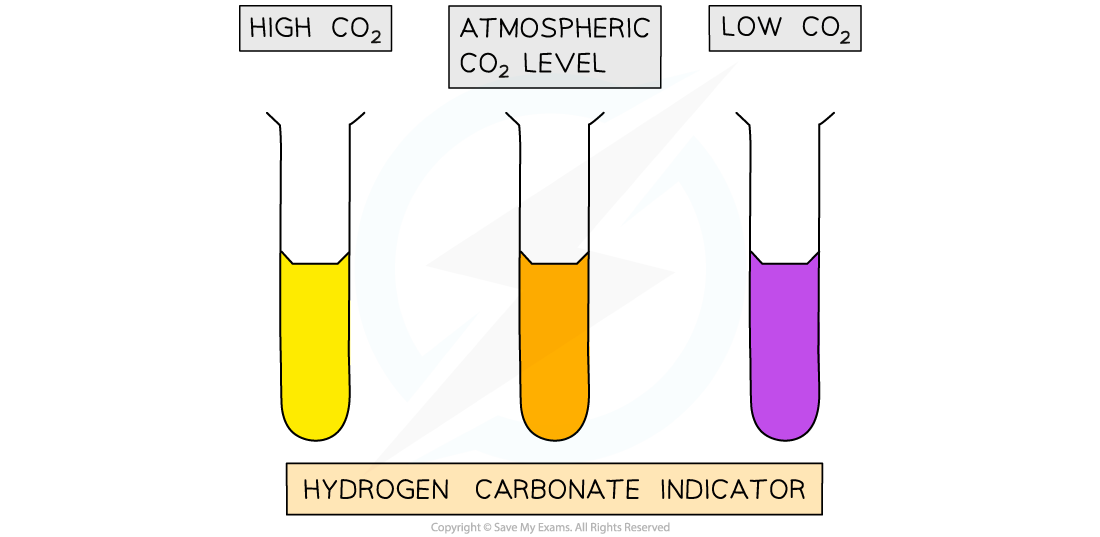
Hydrogen carbonate indicator, which changes colour with changing CO₂ levels
Resazurin, which changes colour as oxygen is used up (it becomes reduced)
Gas sensors and data loggers, which measure changes in O₂ and CO₂ concentration directly
By comparing results under different temperatures, substrate concentrations, or organism types, we can demonstrate how respiration rate depends on enzyme-controlled reactions within living cells
Examiner Tips and Tricks
Note that this practical is a 'suggested practical' in the specification, rather than content that all students are expected to learn. Some schools may choose to complete alternative practicals, or may miss out practical work that is not realistic, e.g. due to equipment or time constraints.
Apparatus
Hydrogen carbonate indicator
Small living organisms (e.g. germinating seeds or woodlice)
Boiled seeds / glass beads (control)
Airtight containers or boiling tubes with rubber bungs
Gauze/mesh platform (to keep organisms off the liquid)
Optional: water bath for temperature control
Optional: a lamp (if also comparing light/dark with plant material)
Method
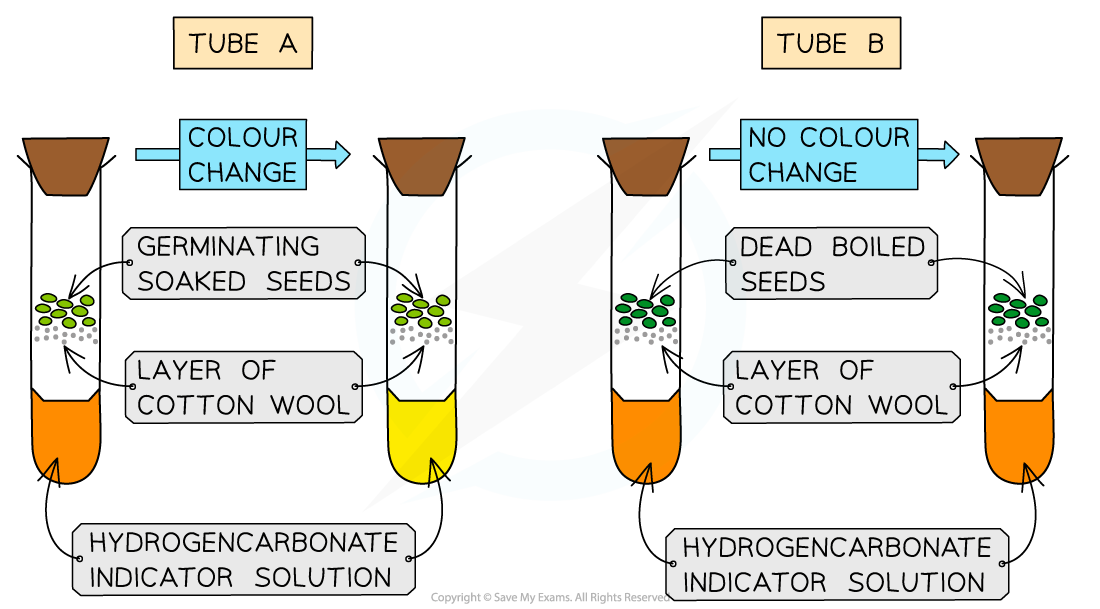
Add 2–3 cm³ hydrogen carbonate indicator to each tube. Fit a mesh platform above the liquid surface
Set up tubes:
A (respiring): living organisms (equal mass/number)
B (control): boiled seeds or glass beads (same volume)
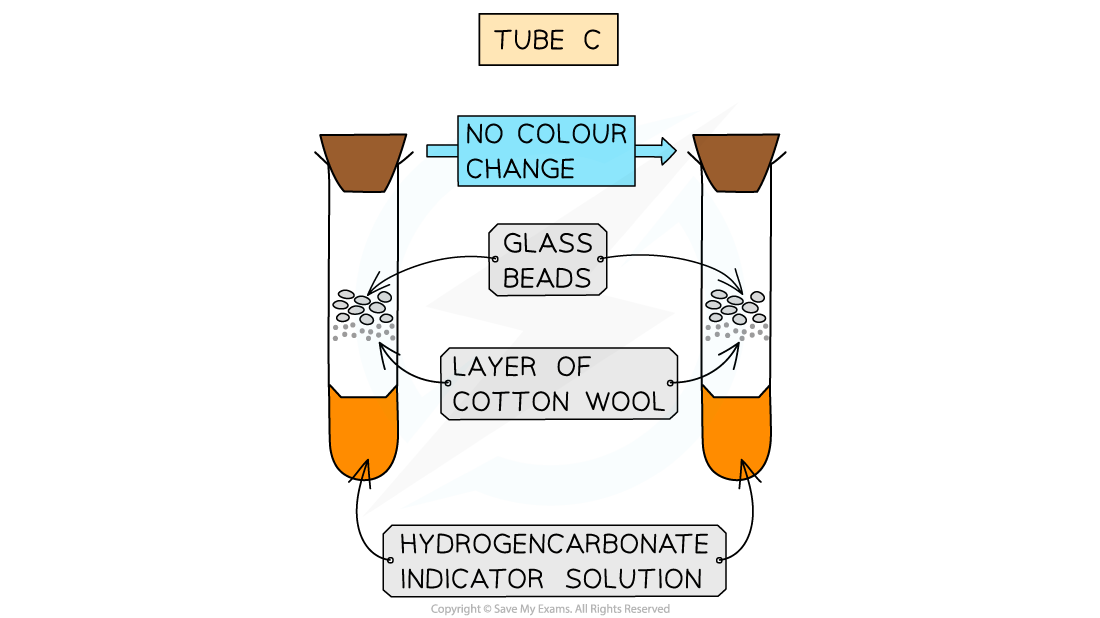
Optional C (no organisms): indicator only (air control)
Seal with bungs, ensuring no direct contact between organisms and the indicator
Keep all tubes at the same temperature (bench or water bath)
Start the timer
Observe and record colour changes at set intervals (e.g. every 2–5 min) for 20–30 min
(If comparing temperature/light): repeat at different temperatures, or light vs dark
Expected results
In this investigation, we would expect to note the following
Tube A should turn yellow as the seeds are respiring and producing carbon dioxide
Tube B should remain orange as the dead seeds produce no carbon dioxide
Tube C should turn purple as there is no living material in there
The faster the change to yellow, the higher the rate of respiration / carbon dioxide production
Limitations & improvements
Airtightness
Leaks dilute carbon dioxide changes
Improvement: Check bungs and joints; use grease/parafilm.
Temperature drift
Room temperature can vary, affecting the rate of respiration in the organisms
Improvement: Use a water bath; pre-equilibrate tubes
Unequal biomass / activity
Different numbers/masses of living organisms can skew results
Improvement: Standardise mass and species; repeat at least three times
Subjective colour judgement
Relying on the human eye can be subjective; borderline colours can make results unclear
Improvement: Use a colorimeter (absorbance) or a printed colour chart for comparison to test colours
Investigating the rate of respiration
Respirometers are used to measure and investigate the rate of oxygen consumption during aerobic respiration in organisms
The experiments usually involve organisms such as seeds or invertebrates
By adding the apparatus to a thermostatically controlled water bath, the effect of temperature on the rate of respiration can be investigated
Examiner Tips and Tricks
Note that this practical is a 'suggested practical' in the specification, rather than content that all students are expected to learn. Some schools may choose to complete alternative practicals, or may miss out practical work that is not realistic, e.g. due to equipment or time constraints.
Apparatus
Respirometer
Glass beads
Germinating seeds
These will be actively respiring and consuming oxygen
Temperature-controlled water bath
Test tubes
Soda-lime pellets
To absorb the carbon dioxide produced
Stopwatch
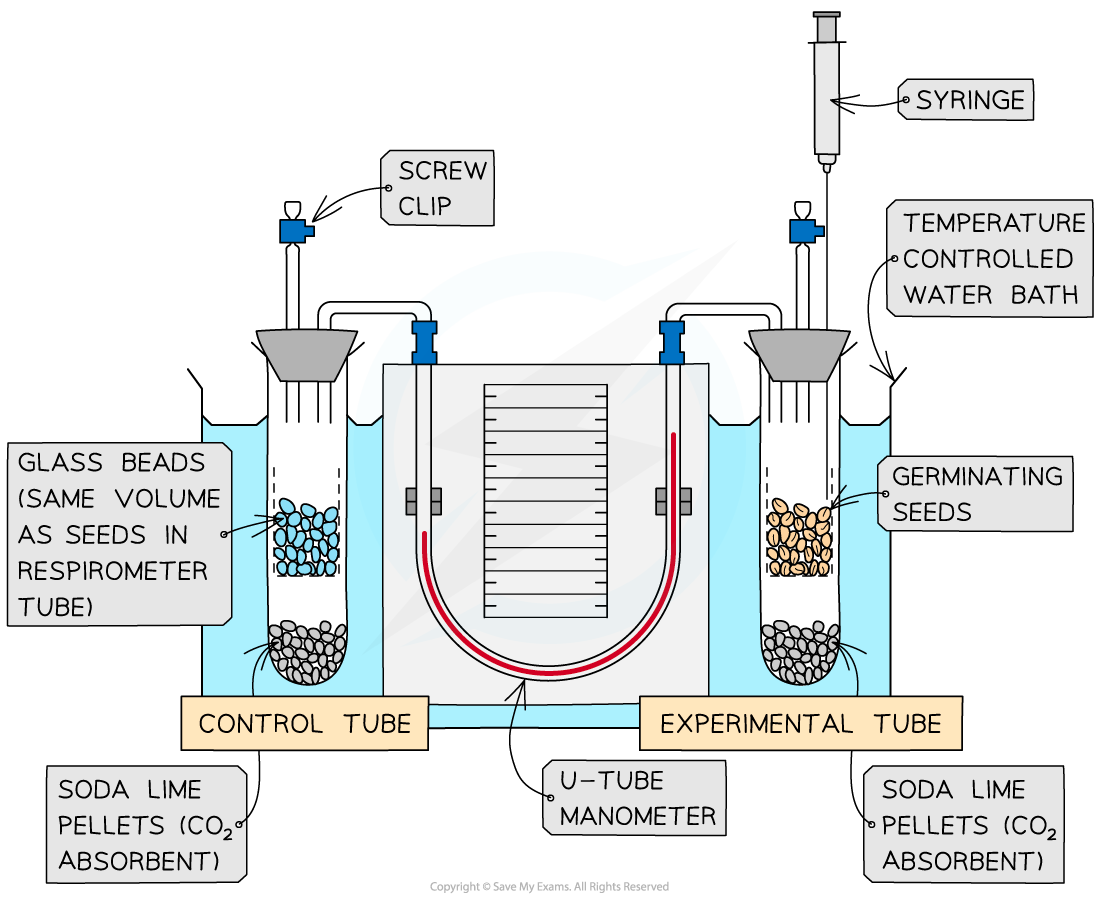
Respirometer set up with temperature-controlled water bath
Method
Set up the respirometer with both tubes in a water bath at a controlled temperature
Allow the apparatus to equilibrate, then close the screw clip to begin the experiment
Use the manometer reading to measure the change in gas volume over a fixed time (e.g. x cm³ min⁻¹)
Reset the apparatus by opening the screw cap to allow air in and using the syringe to reset the manometer fluid
Change the temperature of the water bath and allow the tubes to acclimate.
Repeat the experiment at the new temperature and record the change in gas volume (e.g. y cm³ min⁻¹)
Continue for several different temperatures to compare oxygen consumption rates
Calculations
The volume of oxygen consumed (cm3 min-1) can be worked out using the radius of the capillary tube r (cm) and the distance moved by the manometer fluid h (cm) in a minute, using the formula:
πr2h
Expected results
The rate of oxygen consumption (cm3 min-1) is often taken as the rate of respiration for organisms
The different volumes of oxygen consumed obtained for the different temperatures can be presented in table or graph form to show the effects of temperature
Temperature | Expected Observation | Explanation |
|---|---|---|
Low (e.g. 10–20°C) | Slow movement of manometer fluid → low oxygen uptake | Enzymes controlling respiration have low kinetic energy → low metabolic rate |
Optimum (e.g. 30–40°C) | Fastest movement of manometer fluid → highest oxygen uptake | Enzyme activity at optimum → maximum respiration rate |
High (e.g. above 50°C) | Reduced or no movement of manometer fluid → low oxygen uptake | Enzymes denature, slowing or stopping respiration |

Limitations
The respirometer set up above is for measuring the rate of aerobic respiration. It cannot be used to measure the rate of anaerobic respiration as no oxygen is consumed during anaerobic respiration, as shown by the different equations for aerobic and anaerobic respiration.
Aerobic respiration: Glucose + Oxygen → Energy + Carbon Dioxide
Anaerobic respiration (in mammals): Glucose → Energy + Lactic acid

Unlock more, it's free!
Join the 100,000+ Students that ❤️ Save My Exams
the (exam) results speak for themselves:

Was this revision note helpful?