Monohybrid Inheritance (SQA National 5 Biology): Revision Note
Exam code: X807 75

Written by: Ruth Brindle
Updated on
Monohybrid crosses
Monohybrid inheritance is the inheritance of characteristics controlled by a single gene
This can be determined using a genetic diagram known as a Punnett square
A Punnett square diagram shows the possible combinations of alleles that could be produced in the offspring
From this, the ratio of these combinations can be worked out
Remember, the dominant allele is shown using a capital letter and the recessive allele is shown using the same letter but lowercase
Constructing Punnett squares
To construct a Punnett square, these steps can be followed:
Determine the parental genotypes
Select a letter that has a clearly different lowercase, for example, Aa, Bb, Dd (avoid letters such as Cc or Ss)
Split the alleles for each parent
Add them to the Punnett square around the outside
Fill in the middle four squares of the Punnett square to work out the possible genetic combinations in the offspring
You may be asked to
comment on the ratio of different allele combinations in the offspring
calculate percentage chances of offspring showing a specific characteristic
determine the phenotypes of the offspring
Completing a Punnett square allows you to predict the probability of different outcomes from monohybrid crosses
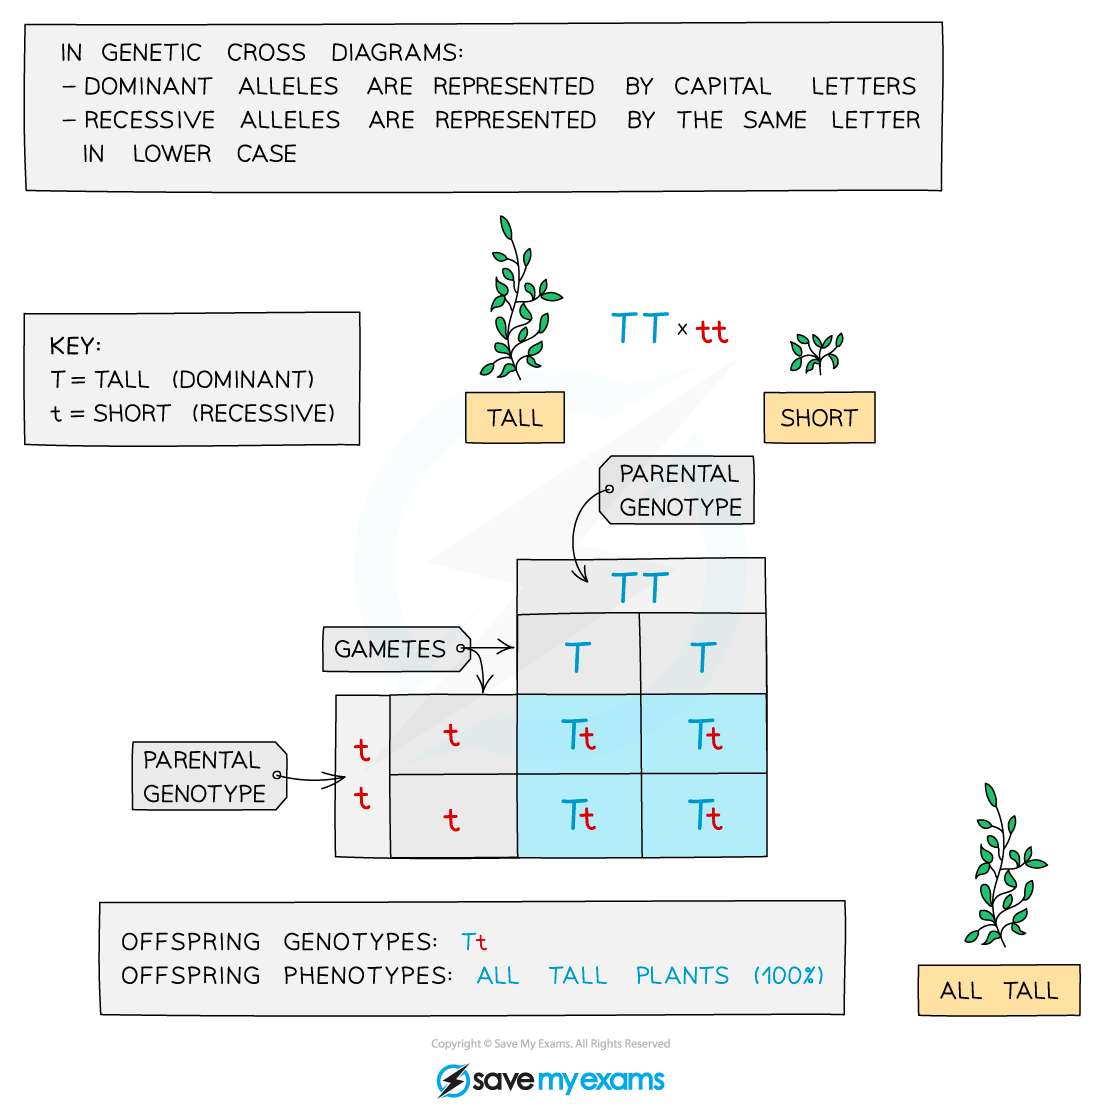
Example of monohybrid inheritance: Pea plants
The height of pea plants is controlled by a single gene that has two alleles: tall and short
The tall allele is dominant and is shown as T
The small allele is recessive and is shown as t
A pure-breed short plant is bred with a pure-breed tall plant
The term ‘pure breed’ indicates that the individual is homozygous for that characteristic
Crossing the offspring from the first cross
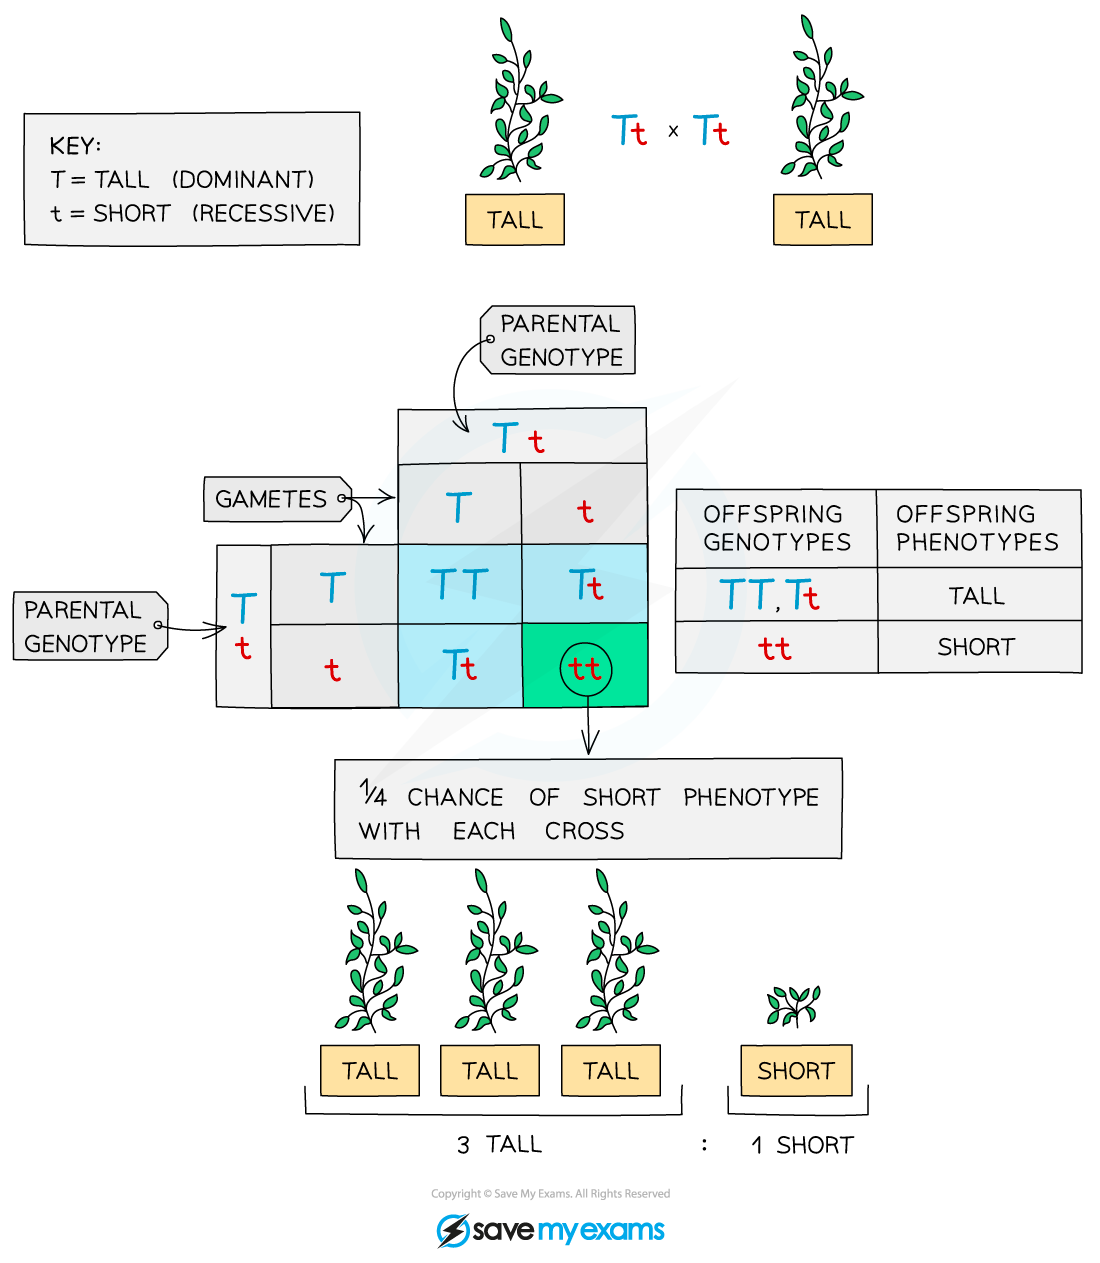
Interpreting the results
All of the offspring of the first cross have the same genotype, Tt (heterozygous), so the possible combinations of offspring bred from these are:
TT (tall)
Tt (tall)
tt (short)
There is more variation in the second cross, with a 3:1 ratio of tall : short
The F2 generation is produced when the offspring of the F1 generation (pure-breeding parents) are allowed to interbreed
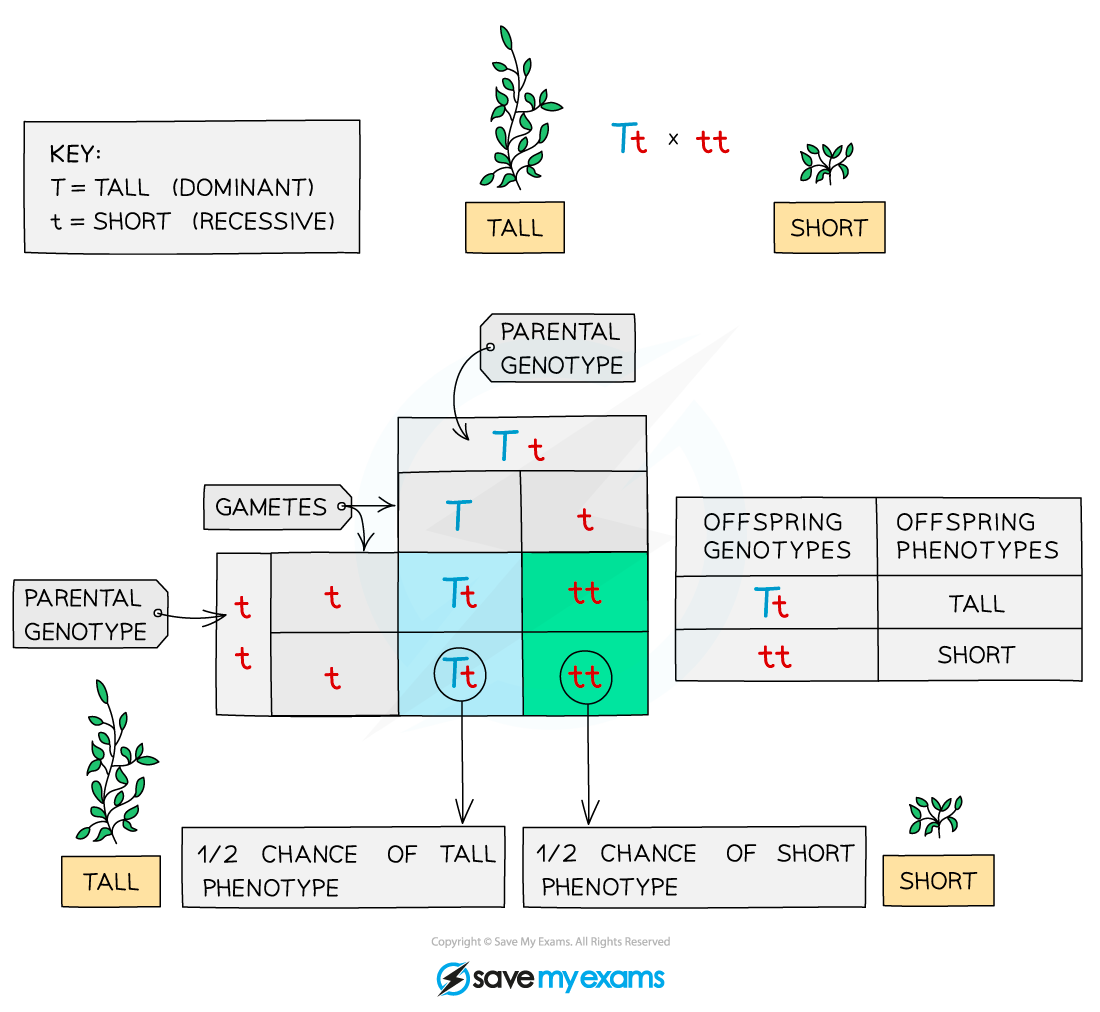
Crossing a heterozygous plant with a short plant
The heterozygous plant will be tall with the genotype Tt
The short plant is showing the recessive phenotype and so must be homozygous recessive – tt
The results of this cross are as follows:
Predicting phenotype ratios
Predicted phenotype ratios (such as 3:1 in a monohybrid cross) show the expected outcomes of a genetic cross in theory
However, the actual results in offspring often differ from these predictions due to several factors:
Chance (random fertilisation):
Fertilisation is a random process, so the actual combinations of alleles that occur can vary from predicted ratios, especially when sample sizes are small
Small sample size:
With few offspring, random variation can cause ratios to differ noticeably from the expected values
Larger numbers of offspring usually produce ratios closer to predictions
Environmental effects:
The environment can influence how genes are expressed, meaning the observed phenotype may not exactly match the genotype
Predicted ratios are theoretical probabilities, and random chance, small sample sizes and environmental influences can all cause real-life results to differ

Unlock more, it's free!
Join the 100,000+ Students that ❤️ Save My Exams
the (exam) results speak for themselves:

Was this revision note helpful?