Practical: Variation in Organisms (SQA National 5 Biology): Revision Note
Exam code: X807 75

Written by: Ruth Brindle
Updated on
Investigating variation in organisms
Two species of snail from the same genus, Capaea, are found commonly in woodlands and grassland habitats in the UK
The different variations in shell pattern across the two snail species show discrete variation
We can investigate the frequency of the different patterns in the populations of snails in woodland and grassland areas to show the effect of habitat on variation
There are four shell patterns:
Apparatus
Quadrat (to select random sample areas)
Camera or tablet (to photograph snails in their habitat)
Identification key or species guide (to confirm snail species)
Clipboard, field notebook or recording sheet (for tallying counts and habitat notes)
Pencil and waterproof labels (for data recording outdoors)
Ruler or measuring tape (to mark quadrat area if adjustable)
Compass (to record sampling orientation if required)
Gloves (for safe handling if needed)
Calculator (for processing results)
Method
Select two different habitats where snails can be found, such as woodland and grassland
Place a quadrat at random positions within the first habitat to collect an unbiased sample
Take a clear photograph of all snails visible within the quadrat without touching or moving them
Repeat this process in different random quadrat positions until 50 snails have been photographed in total for that habitat
Repeat steps 2 to 4 in the second habitat to collect a comparable sample of 50 snails
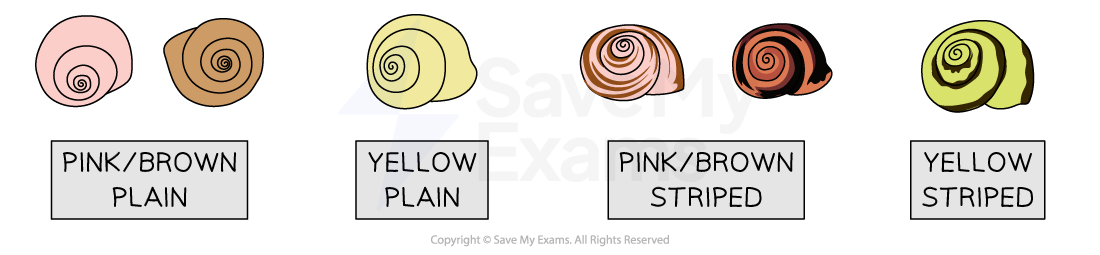
Use the photographs to identify and categorise each snail into one of four variants: pink/brown plain, yellow plain, pink/brown striped, or yellow striped
Record the number of each snail type in a results table for each habitat
For each habitat, the snails are categorised into one of the four different variants:
Pink/brown plain
Yellow plain
Pink/brown striped
Yellow striped
Present the results in a bar chart to compare the frequency of the four colour variants between habitats
Keep the quadrat size, sampling method, and time of day the same in both habitats to ensure a fair test
Leave all snails in their natural environment and avoid handling them to maintain ethical fieldwork practices
Expected results
An efficient way to record the frequency of snails within each category is to use a tally chart:
Snail type | Woodland | Grassland | ||||
|---|---|---|---|---|---|---|
Tally | Number | % | Tally | Number | % | |
Pink/brown plain | 17 | 34 | 12 | 24 | ||
Yellow plain | 7 | 14 | 17 | 34 | ||
Pink/brown striped | 18 | 36 | 7 | 14 | ||
Yellow striped | 8 | 16 | 14 | 28 | ||
These results can then be presented in a bar chart:

Results analysis and conclusions
Results analysis is about looking at the data to identify the key trends
In the table above, we can see that:
all snails were recorded in both habitats
more pink/brown striped and pink/brown plain snails recorded in woodland compared to grassland
more yellow plain and yellow striped snails recorded in grassland compared to woodland
more than double the number of yellow plain snails recorded in grassland compared to woodland
more than double the number of pink/brown striped snails recorded in woodland compared to grassland
Examiner Tips and Tricks
Note that this practical is a 'suggested practical' in the specification, rather than content that all students are expected to learn. Some schools may choose to complete alternative practicals, or may miss out practical work that is not realistic, e.g. due to equipment or time constraints

Unlock more, it's free!
Join the 100,000+ Students that ❤️ Save My Exams
the (exam) results speak for themselves:

Was this revision note helpful?