Practical: Ecological Sampling (SQA National 5 Biology): Revision Note
Exam code: X807 75

Written by: Naomi Holyoak
Updated on
Investigating population size
Sampling techniques can be used to investigate organisms in their environment, e.g. it is possible to measure:
the abundance of plants or invertebrates in an area
the effect of light / moisture on the abundance of plants in an area
Examiner Tips and Tricks
Note that these practicals are 'suggested practicals' in the specification, rather than content that all students are expected to learn. Some schools may choose to complete alternative practicals, or may miss out practical work that is not realistic, e.g. due to equipment or time constraints.
Investigating the abundance of plants in an area
A simple quadrat investigation can be used to estimate the abundance of a plant species at a particular sample site, e.g. on a school field
Apparatus
Long measuring tape x 2
Calculator
Quadrat
Clipboard with paper and pencil
Plant ID guide (optional)
Method
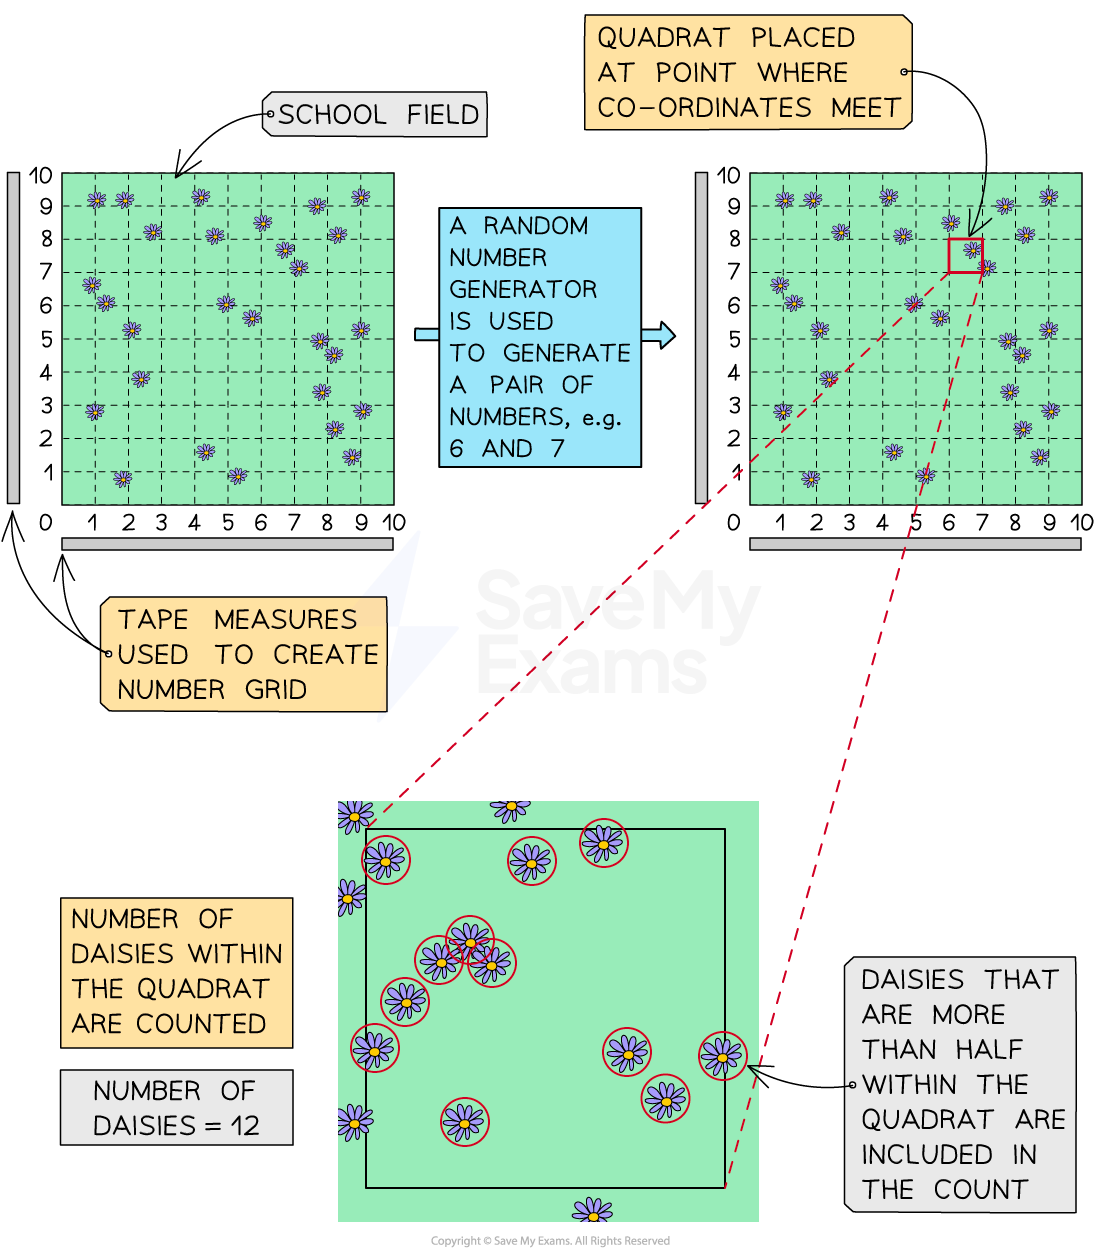
Position your quadrats at random sample sites
Lay out two tape measures at the edges of a habitat; this creates a grid
Use a random number generator to choose two numbers that will function as grid co-ordinates
Place the quadrat at the intersect of the co-ordinates
Take a measure of abundance, e.g.:
count the number of individuals of a particular species within the quadrat
determine the percentage cover of a particular species by counting the number of small squares in which the species occurs
Repeat, while keeping a running mean; this ensures that your sample is large enough to be representative:
Start with 5 quadrats and calculate the mean number of individuals per quadrat (number of individuals ÷ 5)
Sample another quadrat and recalculate the mean (number of individuals ÷ 6)
Repeat until the mean value stabilises
Estimate abundance for the entire sample site, e.g.:
calculate the final mean number of individuals per quadrat
calculate the area of a single quadrat
calculate the number of quadrats that will cover the whole sample site
multiple the mean by the number of quadrats
Worked Example
A student carried out a series of quadrat samples in order to estimate the number of daisies (Bellis perennis) on a part of the school grounds. The area studied covered an area of 600 m2.
The student placed ten quadrats at random sample sites across the field. Each quadrat measured 0.5 x 0.5 m.
The results are shown below:
Quadrat | Number of daisy plants |
|---|---|
1 | 8 |
2 | 12 |
3 | 5 |
4 | 9 |
5 | 15 |
6 | 7 |
7 | 11 |
8 | 10 |
9 | 6 |
10 | 13 |
Estimate the total number of daisies in the part of the school grounds studied
Answer
Step 1: calculate the average number of daisies per quadrat
8 + 12 + 5 + 9 + 15 + 7 + 11+ 10 + 6 + 13 = 96
96 ÷ 10 = 9.6
Step 2: calculate the area of a single quadrat
0.5 x 0.5 = 0.25 m2
Step 3: calculate the number of quadrats that will cover the field
600 ÷ 0.25 = 2400
Step 4: calculate the estimated number of daisies
2400 x 9.6 = 23 040 daisies
Investigating the effect of water availability on the abundance of plants in an area
The availability of water in the soil affects plant growth and survival; areas with more moisture often support a greater abundance of plants, while drier areas may have fewer individuals
It is possible to investigate how water availability influences plant abundance in a habitat
Apparatus
Long measuring tape x 2
Calculator
Quadrat
Soil moisture meter
Clipboard with paper and pencil,
Plant ID guide (optional)
Method
Choose two areas: one wetter and one drier
E.g. a wetter area might be closer to a water source or at a lower elevation
Aim to keep other abiotic factors in the habitat as similar as possible, e.g. similar light, soil type and climate conditions
Random sampling:
Lay out two tape measures at the edges of a habitat; this creates a grid
Use a random number generator to choose two numbers that will function as grid co-ordinates
Place the quadrat at the intersect of the co-ordinates
In each quadrat record:
abundance of one species: either count individuals or estimate % cover
The method used will depend on the species being measured
soil moisture: take 3 quick readings with the meter and record the average
Repeat steps 2-3 for both areas so that you have 10 quadrats per area
Analysis:
Calculate summary values for quick comparison:
the mean plant abundance for each area and
the mean soil moisture.
Plot a bar chart with area on the x-axis (e.g. wetter and drier) and mean plant abundance on the y-axis.
Compare the heights of the bars to describe any difference in abundance between the two areas
Expected results
In general, areas with greater water availability are expected to have a higher overall abundance of plants, as water is needed for photosynthesis, transport and cell support
However, the results for a single species may not match this pattern:
Species that are adapted to dry conditions may be more common in drier soil
Species that need more water will be more abundant in wetter areas
Limitations
Limitation | Suggested solution |
|---|---|
The two areas may differ in more than moisture, e.g. light intensity, levels of trampling and herbivory | Attempt to pick areas that are close to each other Note any differences so that these can be considered during analysis |
Small sample size may not be representative | Carry out more quadrats per area if time allows Use a running mean to ensure that sample is big enough |
Counting may be inconsistent | Agree on a counting approach, e.g. counting all individuals that are more than half inside the quadrat, or using only percentage cover |
Investigating distribution of organisms
The distribution of a species can vary across a habitat depending on abiotic factors such as light intensity, soil moisture, temperature and pH
A line transect can be used to investigate how the distribution of a species changes in response to variation in an abiotic factor across a habitat
Examiner Tips and Tricks
Note that this practical is a 'suggested practical' in the specification, rather than content that all students are expected to learn. Some schools may choose to complete alternative practicals, or may miss out practical work that is not realistic, e.g. due to equipment or time constraints.
Apparatus
Tape measure (30–50 m)
Pegs or markers
Quadrat
Data logger with compatible probes: light, temperature, soil moisture, pH
If no data logger then use a separate light meter, thermometer, moisture meter and pH meter/test kit, then record manually
Method
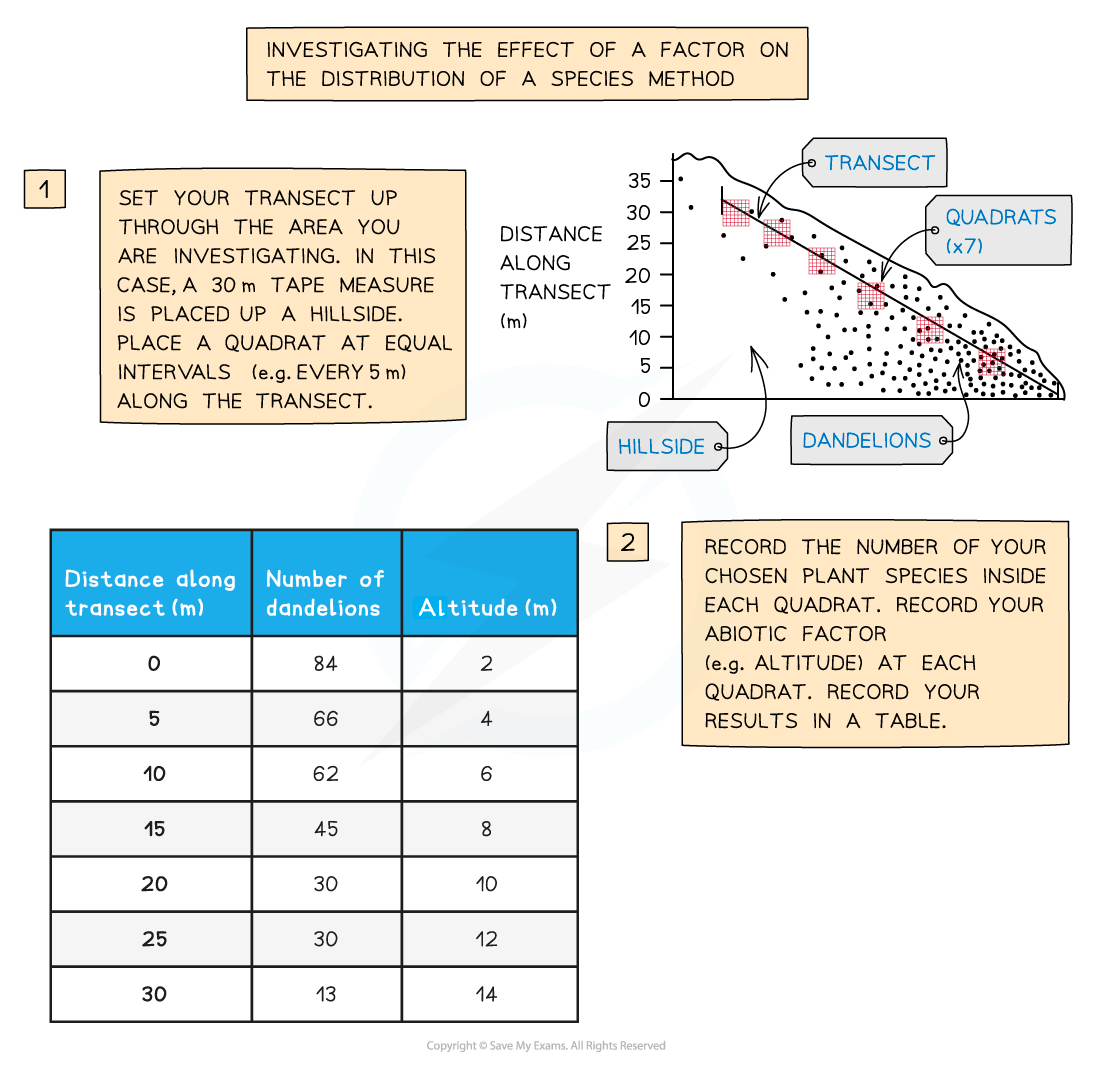
Lay the transect: stretch the tape in a straight line across the study area.
Mark sampling points at regular intervals, e.g. every 2 m
At each point:
Place the quadrat with one edge touching the tape
Record abundance of your chosen species; count individuals or estimate % cover
Measure abiotic factors and record/log immediately, either manually or via the data logger
Light intensity: hold the light probe at plant height
Temperature: log air and ground surface temperature
Soil moisture: insert the probe to the same depth each time
Soil pH: use a pH probe with the logger or a chemical pH test
Repeat at every point along the transect
Replicate: run two more parallel transects
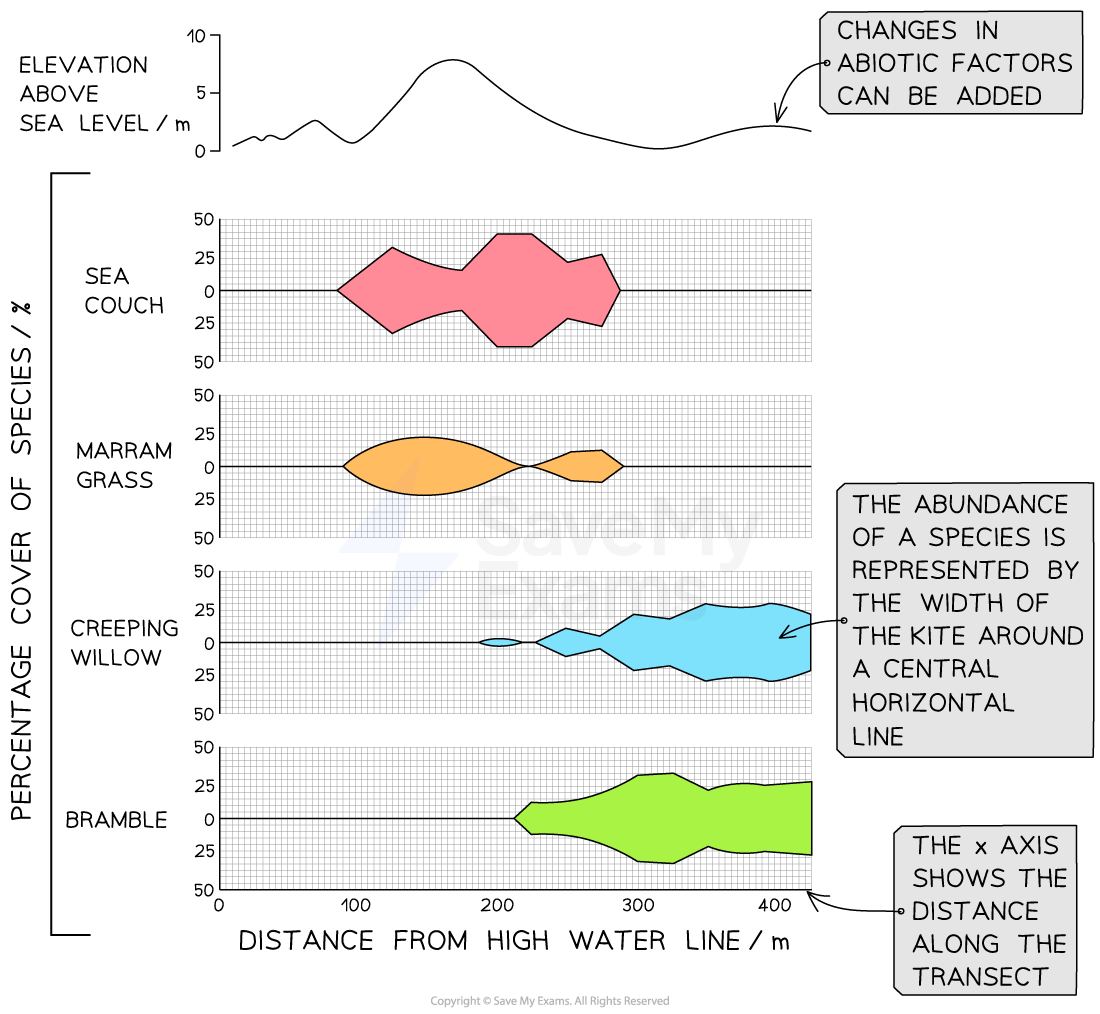
Data from a line transect can be presented visually as a kite diagram as follows:
draw a horizontal line representing the transect distance in metres
for each sampling point, plot a point above and below the line to show the abundance recorded; the distance from the line represents the abundance of the species at that point
join the points with smooth lines to form a continuous, kite-shaped outline
plot the abiotic factors on separate axes that align with the distance along the transect
Expected results
Abundance should peak where conditions meet the needs of the species and fall where they do not, e.g.:
higher abundance in brighter or drier spots suggests a light-demanding or drought-tolerant species
higher abundance in shade or wetter areas points to shade-tolerance or moisture preference
If abundance hardly changes, the species likely has a broad tolerance, or other factors, e.g. competition, are more important
Limitations
Limitation | Suggested solution |
|---|---|
Inconsistent probe use | Keep probe depth / angle the same at every site |
Changing abiotic conditions between samples | Complete the transect in one session |
Shadowing the light sensor | Stand to the side and hold the sensor away from your body |
Species misidentification | Choose a distinctive species Use an ID sheet |
Trampling/disturbance by the team | Walk beside the tape, not on it Place quadrat first, then step around it |

Unlock more, it's free!
Join the 100,000+ Students that ❤️ Save My Exams
the (exam) results speak for themselves:

Was this revision note helpful?