Proteins (SQA National 5 Biology): Exam Questions

Exam code: X807 75

26 mins10 questions
11 mark

Lipase is an enzyme that speeds up the breakdown of fats, producing an acid that decreases the pH.

Three test tubes were set up to investigate the action of lipase on fat in milk.

Three test tubes labelled R, S, and T. R contains milk and lipase, S contains milk and water, T contains milk and boiled lipase.

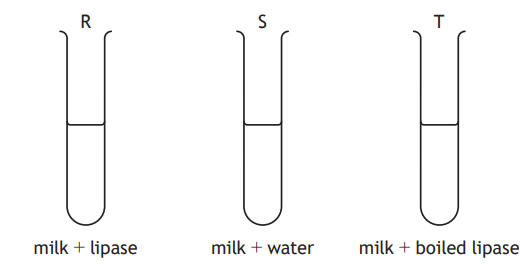
The pH of each test tube was recorded at the start of the experiment and then again 20 minutes later.

In which of the test tube(s) would the pH stay the same?

  • R only

  • T only

  • R and T

  • S and T

2
Sme Calculator
1 mark

A 100 g sample of haemoglobin was found to contain 15 g of leucine.

What mass of leucine would be found in a 5 g sample of haemoglobin?

  • 0.15

  • 0.75

  • 20.0

  • 75.0

3a4 marks

The enzyme invertase is commonly used to make soft-centred chocolates.

Invertase speeds up the following reaction:

sucroserightwards arrow with invertase on topglucose + fructose

An investigation into the effect of pH on invertase at different temperatures was carried out.

The results are shown in the graph.

Graph showing enzyme activity versus pH at 45°C and 55°C. Peaks at pH 5 for both temperatures, higher activity at 45°C, key indicates line styles.

(i) Identify the temperature at which invertase was most active.

[1]

...............................°C

(ii) State the optimum pH of invertase.

[1]

pH..........................

(iii) Predict what would happen to the enzyme activity if the investigation was repeated at 75 °C.

[1]

(iv) Describe how this investigation could be changed to find a more exact optimum temperature of invertase.

[1]

3b1 mark

A different enzyme speeds up the following reaction:

starch rightwards arrowmaltose

Explain why invertase would not speed up this reaction.

41 mark

Which diagram shows the concentration of product during a degradation reaction?

  • Graph showing product concentration over time with a bell-shaped curve. The concentration peaks in the middle and decreases symmetrically in a span of minutes.
  • Graph with a downward sloping line showing concentration of product decreasing over time in minutes; y-axis is labelled "concentration of product", x-axis is "time".
  • Graph showing a linear increase in product concentration over time. Y-axis is concentration of product, x-axis is time in minutes.
  • Graph showing concentration of product versus time. The concentration is constant over time, represented by a horizontal line.
51 mark

A group of scientists investigated the effect of temperature on the growth of genetically modified (GM) cells. The GM cells were grown in a nutrient solution at 20 °C. This was repeated at 30 °C and 40 °C using fresh nutrient solutions at each temperature.

Which of the following would improve the reliability of the results?

  • Set up nutrient solutions containing GM cells at 25 °C and 35 °C.

  • Set up 10 nutrient solutions containing GM cells at each temperature.

  • Use the same concentration of nutrient solution at each temperature.

  • Use the same types of GM cell at each temperature.

6a2 marks

Potatoes store sugar in the form of starch. Glucose‑1‑phosphate (G‑1‑P) molecules are converted to starch in an enzyme‑controlled reaction.

This enzyme can be found in potato extract.

Diagram showing glucose-1-phosphate converting to starch via an enzyme, with hexagonal shapes representing molecules and an arrow indicating transformation.

(i) Identify the type of reaction carried out by this enzyme.

[1]

(ii) Identify the substrate in this reaction.

[1]

6b4 marks

An experiment was set up to investigate the time taken for starch to be produced. All previously made starch was removed from the potato extract.

Two rows of a dimple tile were set up as shown in the diagram.

Diagram with two rows: "G-1-P + potato extract" and "G-1-P + distilled water" across five time points from 0 to 20 minutes, each with a circle.

At 5‑minute intervals the content of the dimples in each column was tested for the presence of starch.

The results are shown in the table.

Starch present

Time (minutes)

G‑1‑P + potato extract

G‑1‑P + distilled water

0

no

no

5

no

no

10

yes

no

15

yes

no

20

yes

no

(i) Suggest a reason for any previously made starch being removed from the potato extract.

[1]

(ii) State two variables that should be controlled to make this experiment valid.

[2]

  1. ...........................................................................................

  2. ...........................................................................................

(iii) Explain how the results show that the enzyme is required for the reaction to occur.

[1]

71 mark

Which of the following statements is true for proteins?

  1. They are made in the nucleus.

  2. They are affected by temperature.

  3. They can be found in the cell membrane.

  4. They all function as enzymes.

  • 2 and 3 only

  • 2 and 4 only

  • 1, 3 and 4 only

  • 2, 3 and 4 only

8a2 marks

Pepsin is an enzyme involved in the digestion of proteins, which is a degradation reaction.

The diagram represents three stages that occur in this reaction.

Diagram of enzyme action showing pepsin binding stages: Stage P with separate shapes, Stage Q with partial binding, Stage R with full interaction.

(i) Using letters from the diagram, put the stages into the correct order to show this degradation reaction.

[1]

stage............. rightwards arrowstage ............. rightwards arrowstage .............

(ii) Describe the feature of pepsin that allows it to bind to only one substrate.

[1]

8b1 mark

The graph shows the results of an experiment to investigate the effect of pH on pepsin activity.

Line graph showing protein remaining after 24 hours versus pH level, with values increasing from 11% at pH 2 to 100% at pH 8.

Use the graph to identify the optimum pH of pepsin.

pH................................

8c1 mark

Enzymes can be denatured by changes in pH.

Give a reason why the rate of reaction will be affected.

91 mark

The diagram represents three stages in an enzyme-controlled reaction.

Three-step enzyme reaction showing substrates L and M combining into complex, then converting into product N, leaving enzyme K unchanged.

Which row in the table identifies the labelled structures?

Substrate

Enzyme

Product

A

L

N

K

B

N

K

M

C

K

L

N

D

M

K

N

    10a
    Sme Calculator
    1 mark

    An investigation was carried out into the breakdown of cooked egg white by enzymes.

    2 g of cooked egg white was placed in each of four test tubes containing different enzyme solutions at different pH levels as shown.

    Four test tubes labelled A to D contain cooked egg white. A and B with pepsin at pH 2 and 7. C and D with catalase at pH 2 and 7.

    The test tubes were placed in a water bath at 37 °C for 2 hours.

    The cooked egg white was then removed and weighed.

    The results are shown in the table.

    Test tube

    Mass after 2 hours (g)

    Change in mass (g)

    % change in mass

    A

    0.3

    85.0

    B

    1.9

    0.1

    5.0

    C

    2.0

    0

    0

    D

    2.0

    0

    0

    Complete the table by calculating the change in mass of the egg white in test tube A.

    10b2 marks

    (i) Explain why the change in mass in test tube B was less than in test tube A.

    [1]

    (ii) Explain why there was no change in mass in test tubes C and D.

    [1]

    10c2 marks

    If the investigation was repeated at 70 °C, describe the change in the:

    (i) structure of the active site of the enzymes

    [1]

    (ii) rate of the reaction in test tubes A and B.

    [1]