1
1 mark
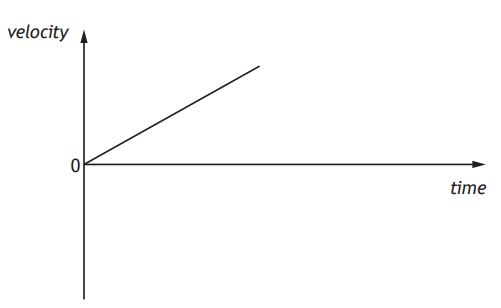
The graph shows how the speed of a runner changes during the last 8.0 seconds of a race.
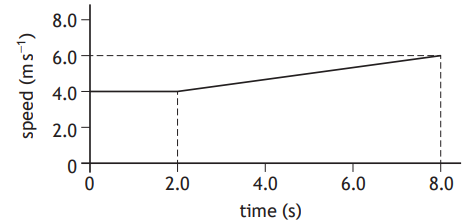
The distance travelled during the 8.0 seconds is
24 m
32 m
38 m
44 m
48 m
Was this exam question helpful?
Exam code: X857 75
The graph shows how the speed of a runner changes during the last 8.0 seconds of a race.
The distance travelled during the 8.0 seconds is
24 m
32 m
38 m
44 m
48 m
Was this exam question helpful?
The graph of speed v against time t represents the motion of a cyclist over a 20 second period.
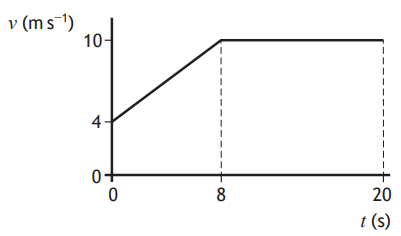
The distance travelled by the cyclist in the 20 second period is:
56 m
144 m
160 m
176 m
200 m
Was this exam question helpful?
A glider is accelerated from rest by a cable attached to a winch.
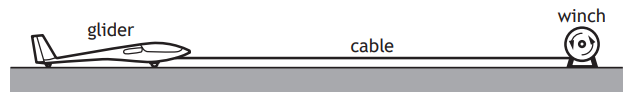
The graph shows the horizontal velocity vh of the glider for the first 20 s of its motion.
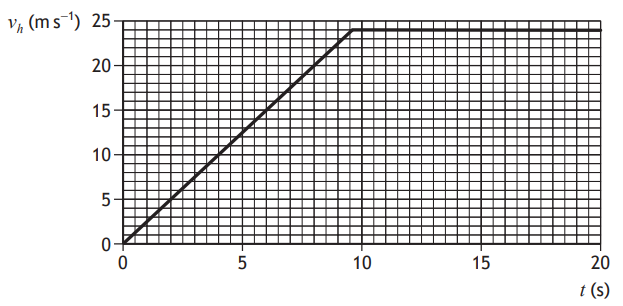
At 8·0 s the glider reaches its take-off speed and leaves the ground.
Determine the distance the glider travels along the ground before take-off.
Was this exam question helpful?
The graph represents the motion of a bus travelling along a straight, level road between two stops.
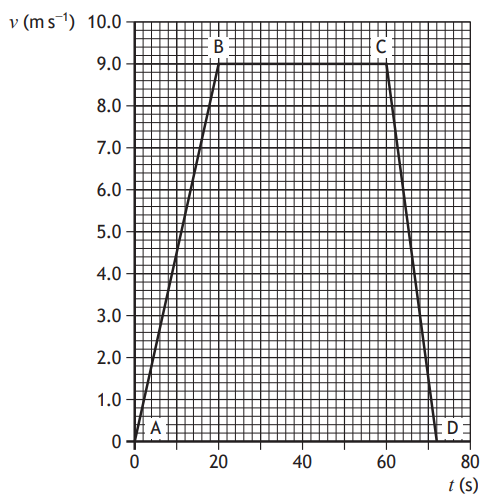
Describe the motion of the bus:
(i) between A and B
[1]
(ii) between B and C.
[1]
Determine the distance travelled by the bus between A and D.
Was this exam question helpful?
A student uses a motion sensor and a computer to determine the acceleration of the trolley.
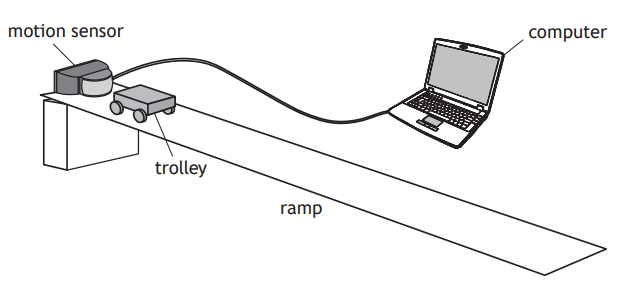
The student releases the trolley. The computer displays the velocity-time graph for the motion of the trolley as it rolls down the ramp, as shown.
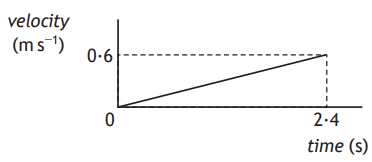
Determine the distance travelled by the trolley in the first 2·4 s after its release.
In a further experiment the student places a piece of elastic across the bottom of the ramp as shown.
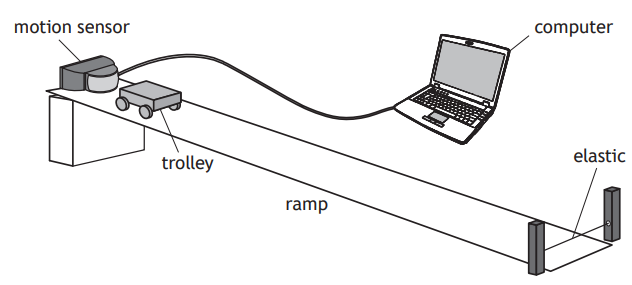
The student again releases the trolley. The trolley rolls down the ramp and rebounds from the elastic to move back up the ramp.
Using the axes provided, complete the velocity-time graph for the motion of the trolley from the moment it contacts the elastic, until it reaches its maximum height back up the ramp.
Numerical values are not required on either axis.
Was this exam question helpful?