Wave Parameters & Behaviours (SQA National 5 Physics): Exam Questions

Exam code: X857 75

55 mins18 questions
1
Sme Calculator
1 mark

The diagram represents a wave.

A sine wave showing a wavelength of 12 metres and an amplitude of 0.4 metres, with dashed lines indicating measurements.

The speed of the wave is 3.0 m s−1.

Which row in the table shows the amplitude and frequency of this wave?

Amplitude (m)

Frequency (Hz)

A

0.2

0.25

B

0.2

0.50

C

0.2

2.0

D

0.4

0.50

E

0.4

2.0

    21 mark

    Which diagram shows the diffraction of water waves as they pass through a gap in a barrier?

    • Diagram showing wave diffraction through a gap. An arrow indicates the wave direction towards the gap, with curved lines illustrating wave spread.
    • Diagram showing wave direction with an arrow moving through a narrow gap between two barriers, illustrating the concept of diffraction.
    • Diagram showing wavefronts traveling through slits, illustrating wave diffraction. An arrow indicates the direction of wave travel towards the slits.
    • Diagram showing wave diffraction through a narrow gap; waves approach from the left, bend and spread upon passing through the gap on the right.
    • Diagram illustrating wave diffraction through a double slit, showing waves travelling rightwards and spreading out after passing through the openings.
    3a
    Sme Calculator
    4 marks

    Some cars have parking sensors that emit pulses of ultrasound.

    Ultrasound is high frequency sound waves. The emitted sound waves reflect from objects and are detected by sensors on the car.

    During testing, a stationary car emits a sound wave with a frequency of 48 000 Hz.

    The wave reflects from a wall and is detected by the sensors on the car.

    Diagram of a car emitting a sound wave towards a wall; the wave reflects back to the car. Labels: transmitted and reflected sound waves.

    The time taken between the sound wave being emitted and detected by the car is 0.015 s.

    Determine the distance between the car and the wall.

    3b
    Sme Calculator
    3 marks

    The system in the car is now adjusted to emit sound waves with a different frequency.

    An oscilloscope connected to the system displays the following trace for the sound waves emitted by the car.

    Graph showing oscillating wave pattern over time from 0 to 2.0 x 10^-4 seconds on the horizontal axis, with amplitude on the vertical axis.

    (i) Show that the frequency of this sound wave is 45 000 Hz.

    [2]

    (ii) Explain why the time taken between this sound wave being emitted and detected is also 0.015 s.

    [1]

    4a2 marks

    The diagram shows the electromagnetic spectrum in order of increasing wavelength.

    Diagram of the electromagnetic spectrum showing gamma rays, X-rays, P, visible light, Q, microwaves, and radio waves by increasing wavelength.

    State which part of the electromagnetic spectrum experiences the greatest amount of diffraction.

    Justify your answer.

    4b
    Sme Calculator
    3 marks

    Electromagnetic radiation has many applications in everyday life.

    Wireless headphones receive electromagnetic waves with a frequency of 2.42 GHz from an audio device.

    Two white wireless earbuds on a grey background, positioned at angles with visible speakers and charging connectors, showcasing modern design.

    (i) Show that the wavelength of these waves is 0.12 m.

    [2]

    (ii) Identify the part of the electromagnetic spectrum that these waves belong to.

    [1]

    51 mark

    Which of the following is a longitudinal wave?

    • sound

    • radio

    • ultraviolet

    • infrared

    • light

    6
    Sme Calculator
    1 mark

    A radio station transmits radio signals with a frequency range from 3.0 MHz to 6.0 MHz.

    The maximum wavelength of the radio signal transmitted is:

    • 0.01 m

    • 0.02 m

    • 50 m

    • 100 m

    • 113 m

    7a
    Sme Calculator
    6 marks

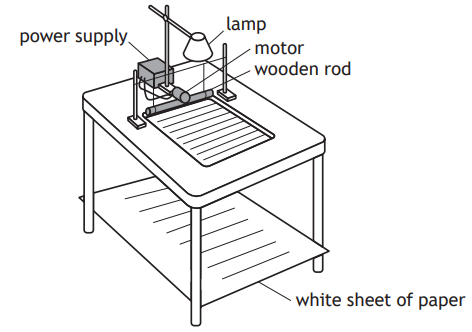
    A student sets up a ripple tank. A ripple tank is a shallow tank of water used to demonstrate wave properties.

    Diagram of an experimental setup with a lamp, motor, and power supply on a table. A wooden rod is above a striped tray with a white sheet below.

    The wooden rod moves in and out of the water to generate water waves.

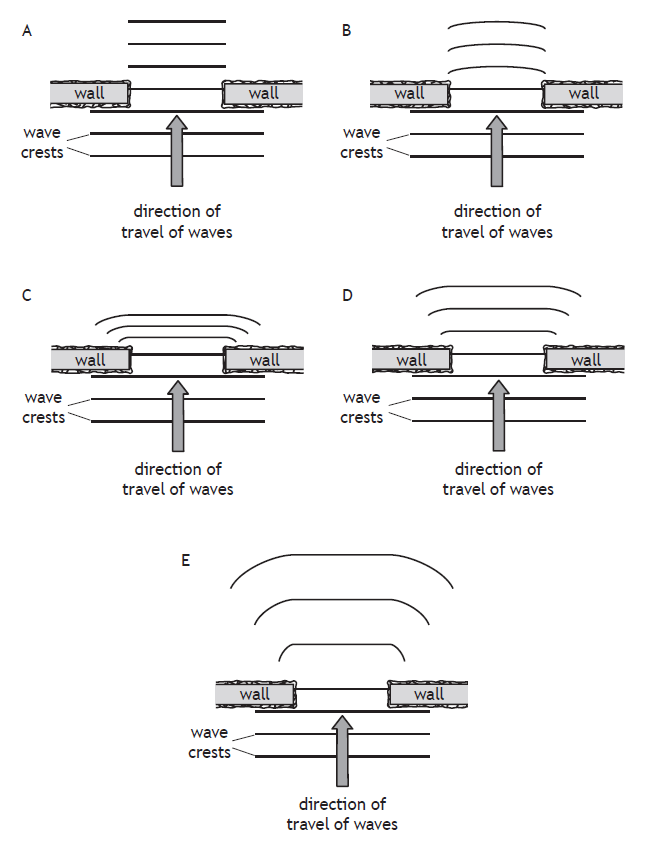
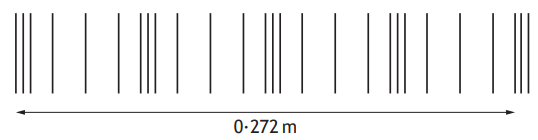
    The pattern of the water waves is projected onto a white sheet of paper below the tank.

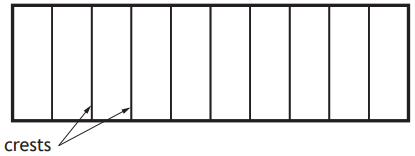
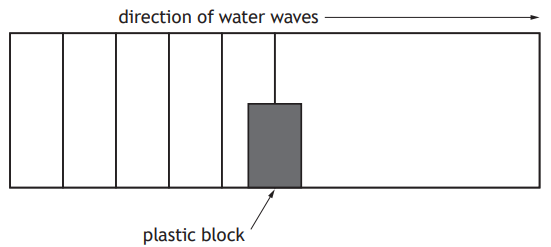
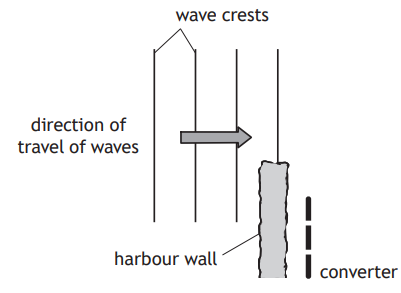
    The wave pattern appears on the paper as a series of bright and dark lines. The dark lines correspond to the wave crests.

    A rectangle divided into ten equal vertical sections is labelled "crests" with arrows pointing to two adjacent sections.

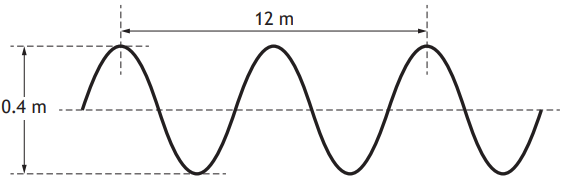
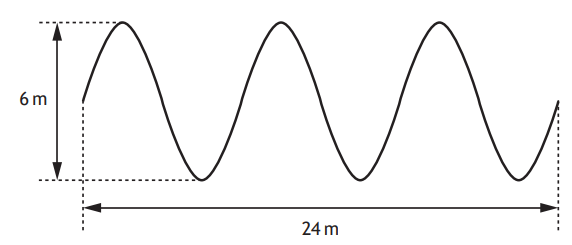
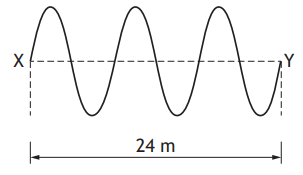
    The student determines that there are six complete waves in 0.12 m.

    (i) Determine the wavelength of the waves.

    [1]

    (ii) The six complete waves are produced in a time of 0.40 s.

    Show that the frequency of the waves is 15 Hz.

    [2]

    (iii) Calculate the speed of the waves.

    [3]

    7b2 marks

    The student now places a plastic block in the ripple tank.

    Diagram showing water waves moving rightward, encountering a grey plastic block. Waves are parallel lines; block is labelled below.

    Complete the diagram to show the pattern of the water waves beyond the plastic block.

    8
    Sme Calculator
    1 mark

    The following diagram gives information about a wave.

    Sine wave with a wavelength of 24 metres and amplitude of 6 metres, illustrating the wave's horizontal and vertical measurements.

    Which row in the table shows the amplitude and wavelength of the wave?

    Wave

    Amplitude (m)

    Wavelength (m)

    A

    3

    4

    B

    3

    8

    C

    6

    4

    D

    6

    8

    E

    8

    3

      91 mark

      A student is studying waves with a period of 80·0 ms and a wavelength of 4·00 m.

      The frequency of these waves is

      • 0·0125 Hz

      • 0·320 Hz

      • 12·5 Hz

      • 80·0 Hz

      • 320 Hz

      101 mark

      Which of the following diagrams shows the diffraction of water waves as they pass between two walls?

      Diagram showing wave diffraction through a gap between walls. Five scenarios, A to E, with varying gap sizes, affecting wave crest patterns and directions.
        11
        Sme Calculator
        3 marks

        A lifeboat crew is made up of local volunteers. When there is an emergency they have to get to the lifeboat quickly.

        The lifeboat crew members are alerted to an emergency using a pager.

        Text messages are sent to the pager using radio waves.

        Illustration of a handheld emergency device with "EMERGENCY CM48" on the screen. The logo "Lifeboats" is visible on the device's body.

        The radio waves have a frequency of 153 MHz.

        Calculate the wavelength of the radio waves.

        12
        Sme Calculator
        1 mark

        The diagram represents a wave travelling from X to Y.

        Diagram of a sinusoidal wave with a horizontal distance marked 24 metres, flanked by points X and Y. The wave has four peaks and three troughs.

        The speed of the wave is 48 m s−1.

        The frequency of the wave is

        • 0.50 Hz

        • 2.0 Hz

        • 6.0 Hz

        • 144 Hz

        • 384 Hz

        13a1 mark

        A wave energy converter is a machine anchored to the seabed that changes the kinetic energy of water waves into electrical energy.

        Diagram of a wave energy converter floating on water, connected by a cable to a generator on the seabed. Labels indicate "wave energy converter" and "seabed".

        Water waves are transverse waves.

        State what is meant by the term transverse wave.

        13b
        Sme Calculator
        4 marks

        An engineer uses a stopwatch to measure the time taken for one complete wave to pass the end of the converter.

        The stopwatch is started when a crest passes the end of the converter and stopped when the next crest passes.

        The time measured by the engineer is 7.4 s.

        (i) Calculate the frequency of the waves.

        [3]

        (ii) Suggest how the accuracy of the frequency of the waves determined by the engineer could be improved.

        [1]

        13c1 mark

        The average electrical power produced by the converter depends on the wave height.

        Diagram of a sinusoidal wave with labelled vertical measurement showing wave height, indicated by a double-headed arrow spanning crest to trough.

        The graph shows how the average electrical power produced by the convertor varies with wave height.

        Line graph showing the relationship between wave height in metres and average electrical power in kilowatts, illustrating an upward trend.

        Use the graph to determine the average electrical power produced by the converter when the amplitude of the waves is 1.5 m.

        13d2 marks

        The wave energy converter is now moved to a position behind a harbour wall, so it can be serviced.

        Waves travel towards the harbour wall, as shown.

        Diagram showing wave energy conversion with wave crests moving toward a harbour wall and converter, indicating the direction of wave travel.

        Complete the diagram to show the pattern of the wave crests beyond the harbour wall.

        14a1 mark

        While at a firework display, a student sees a flash and hears a bang from each firework explosion.

        Crowd watching a bright fireworks display in the night sky, with people silhouetted in the foreground capturing the moment with cameras.

        The student states:

        ‘Measuring the time between seeing a flash and hearing a bang will allow me to calculate the distance to the firework when it explodes.’

        State what additional information is required to calculate the distance between the student and the firework when it explodes.

        14b2 marks

        At one point during the display the student moves to a position near a tall building and, as a result, now hears two bangs from each firework explosion.

        Diagram shows a building, a person, and fireworks in the sky. Text reads "not to scale," indicating size differences aren't accurate.

        State how the amplitude of the second bang from each explosion heard by the student compares to the amplitude of the first bang from each explosion heard by the student.

        You must justify your answer.

        151 mark

        A student makes the following statements about diffraction.

        I Diffraction occurs when waves pass from one medium into another.

        II Waves with a longer wavelength diffract more than waves with a shorter wavelength.

        III Microwaves diffract more than radio waves.

        Which of these statements is/are correct?

        • I only

        • II only

        • I and II only

        • II and III only

        • I, II and III

        16
        Sme Calculator
        1 mark

        The energy of a water wave can be calculated using

        E equals fraction numerator rho g A squared over denominator 2 end fraction

        where: E is the energy of the wave in J

        ρ is the density of the water in kg m−3

        g is the gravitational field strength in N kg−1

        A is the amplitude of the wave in m.

        A wave out at sea has an amplitude of 3·5 m.

        The density of the sea water is 1·02 cross times103 kg m−3.

        The energy of the wave is

        • 6·2 cross times103 J

        • 1·7 cross times104 J

        • 6·1 cross times104 J

        • 1·2 cross times105 J

        • 6·1 cross times108 J

        17a
        Sme Calculator
        3 marks

        A student connects a mobile phone to a speaker wirelessly using a microwave signal.

        A woman stands smiling and using a smartphone. To her right, a speaker with an antenna sits on a small table. Text reads "not to scale" and "speaker".

        The time taken for the microwave signal to travel from the mobile phone to the speaker is 2·1 cross times10−8 s.

        Calculate the distance between the mobile phone and the speaker.

        17b
        Sme Calculator
        5 marks

        Sound is a longitudinal wave.

        The sound produced by the speaker is represented by the following diagram.

        A series of vertical lines resembling a bar code, spanning 0 to 272 metres, with an arrow indicating direction underneath.

        (i) State what is meant by the term longitudinal wave.

        [1]

        (ii) Determine the wavelength of the sound wave.

        [1]

        (iii) Calculate the frequency of the sound wave in air.

        [3]

        18
        Sme Calculator
        3 marks

        A rain sensor is attached to the glass windscreen of a vehicle to automatically control the windscreen wipers.

        Diagram of a rain sensor on a glass windscreen showing labelled components: raindrop, refracted light, LEDs, infrared detectors, and sensor.

        Infrared light is emitted from LEDs and is received by infrared detectors.

        The graph shows how the number of raindrops affects the percentage of infrared light received by the infrared detectors.

        Graph showing percentage of infrared light received by detectors decreasing as the number of raindrops increases from low to high.

        The percentage of infrared light received by the infrared detectors from the LEDs controls the frequency with which the windscreen wipers move back and forth.

        The table shows how the number of times the windscreen wipers move back and forth per minute relates to the number of raindrops.

        Number of raindrops

        Number of times the windscreen wipers move back and forth per minute

        low

        18

        medium

        54

        high

        78

        At one point in time the infrared detectors receive 70% of the infrared light emitted from the LEDs.

        Show that the frequency of the windscreen wipers at this time is 0·90 Hz.