Absorption Spectra & Action Spectra (Cambridge (CIE) A Level Biology): Revision Note
Exam code: 9700

Absorption spectra & action spectra
Absorption spectra
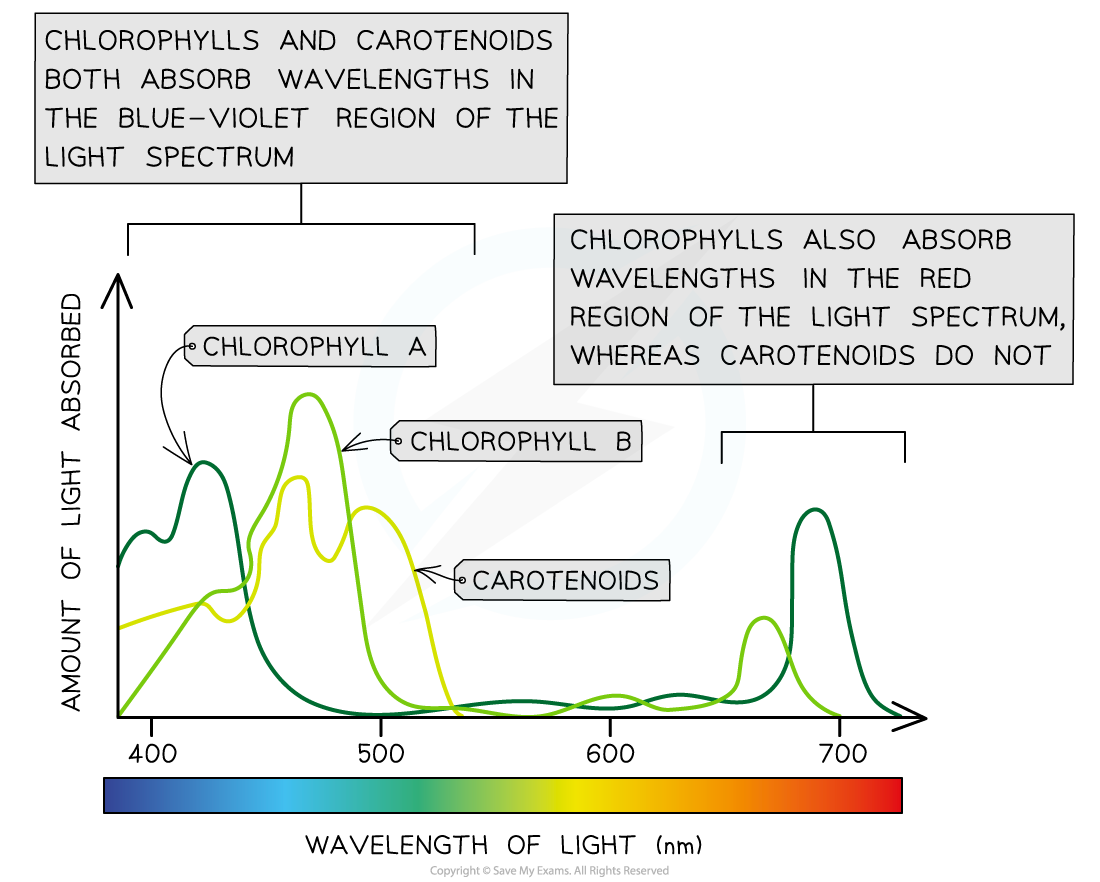
An absorption spectrum is a graph that shows the absorbance of different wavelengths of light by a particular pigment
Chlorophylls absorb wavelengths in the blue-violet and red regions of the light spectrum
Carotenoids absorb wavelengths of light mainly in the blue-violet region of the spectrum
Action spectra
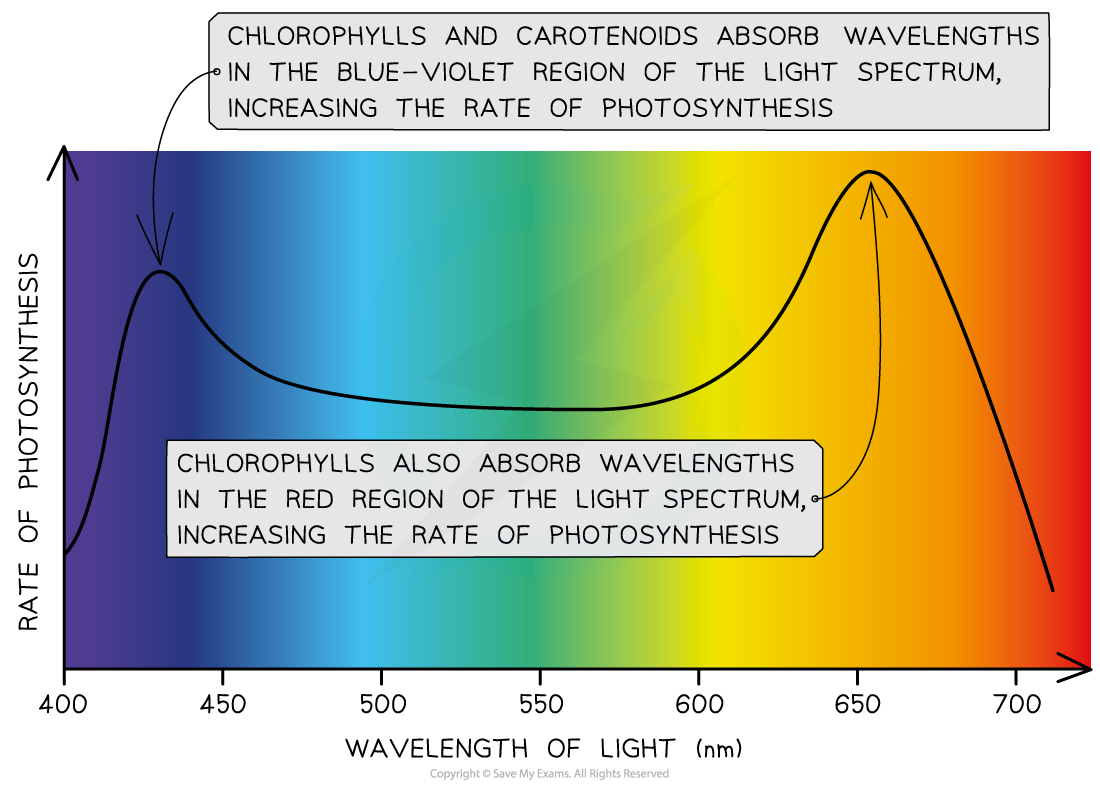
An action spectrum is a graph that shows the rate of photosynthesis at different wavelengths of light
The rate of photosynthesis is highest at the blue-violet and red regions of the light spectrum
This is because these are the wavelengths of light that plants can absorb (i.e. the wavelengths of light that chlorophylls and carotenoids can absorb)
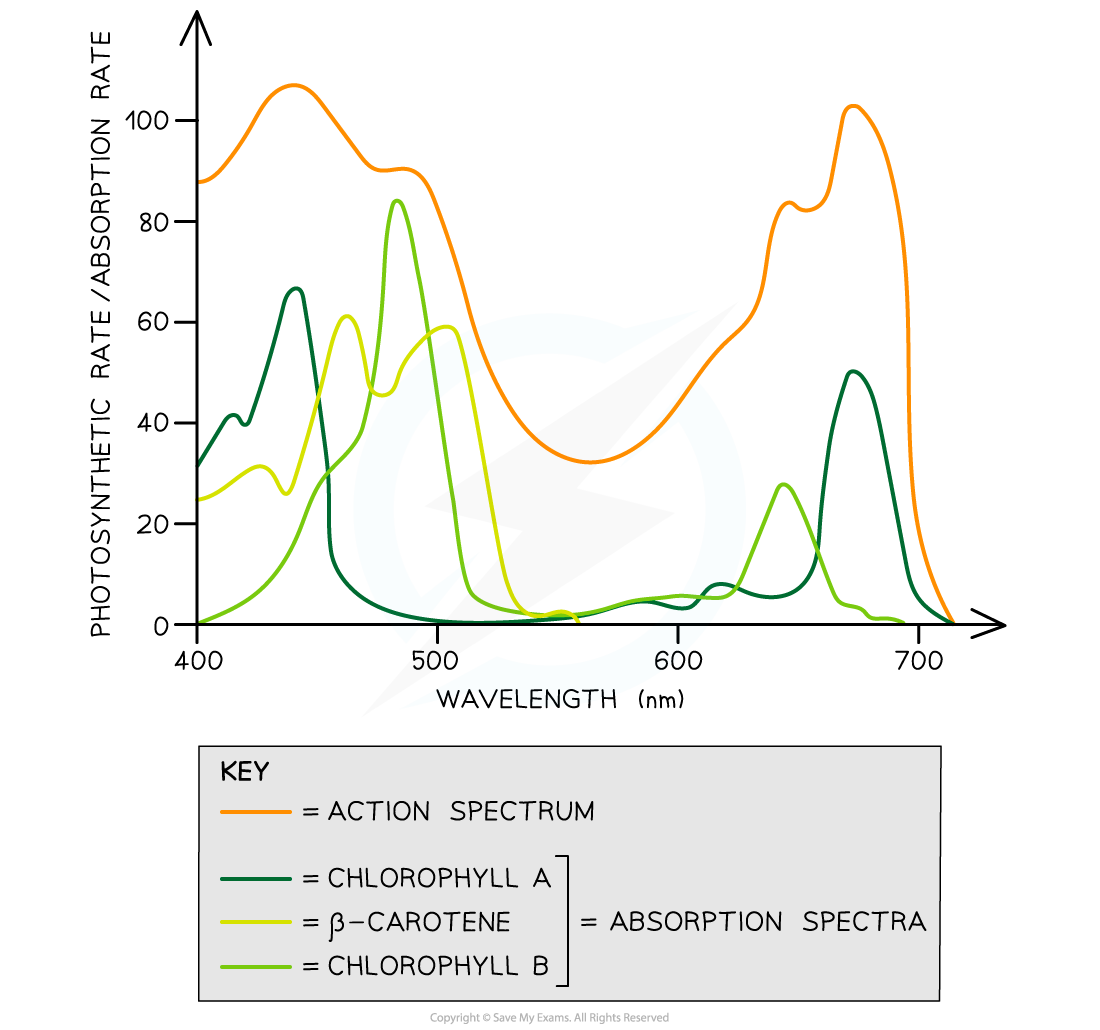
There is a strong correlation between the cumulative absorption spectra of all pigments and the action spectrum:
Both graphs have two main peaks (at the blue-violet region and the red region of the light spectrum)
Both graphs have a trough (in the green-yellow region of the light spectrum)

Unlock more, it's free!
Join the 100,000+ Students that ❤️ Save My Exams
the (exam) results speak for themselves:

Was this revision note helpful?
