State-Transition Diagrams (Cambridge (CIE) A Level Computer Science): Revision Note
Exam code: 9618

State-Transition Diagrams
What are state-transition diagrams?
A state-transition diagram shows how a system moves between different states based on inputs
Each state represents a condition or situation of the system
Transitions are arrows that show movement between states when certain inputs occur
Transitions may also produce outputs, shown as labels on the arrows
These diagrams model finite-state machines (FSMs), which are widely used in computing
Key elements
Element | Description |
|---|---|
State | Circle labelled with a name (e.g. S1, S2) showing a situation the system can be in |
Initial state | Starting point, sometimes marked with an arrow pointing to it |
Transition | Arrow from one state to another, labelled with input and output |
Input | Event or data that causes a transition (e.g. Button-Y pressed) |
Output | Action or signal produced by a transition (e.g. Output-A) |
Next state | The state the system moves into after the transition |
How to read labels on transitions
Labels are often written as Input | Output
If no output is produced, “none” may be written
Example:
Button-Y | Output-Bmeans pressing Button-Y in the current state produces Output-B and causes a transition to the next stateThe diagram below shows the key features of a state-transition diagram:
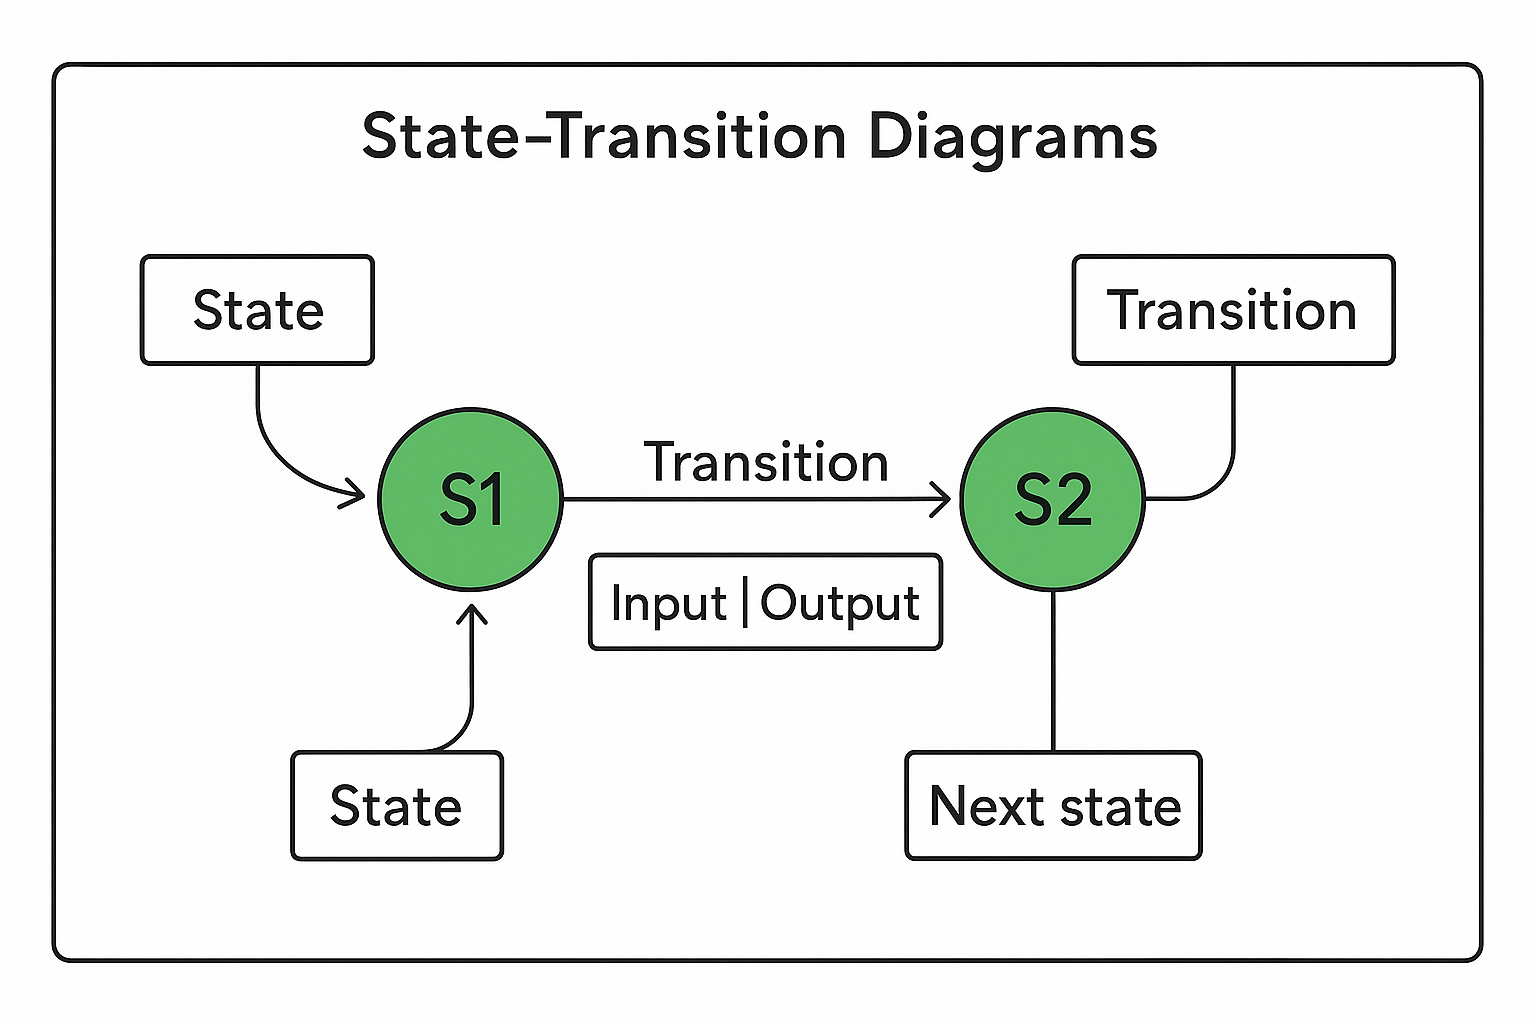
States are circles labelled S1, S2, etc
Transitions are arrows between states, labelled with Input | Output
The initial state is marked with an incoming arrow
Completing transition tables
Exam questions often ask you to convert a diagram into a table
The table normally has columns for Current state, Input, Output, Next state
Work through the diagram row by row, following the arrows for each possible input
Example table structure:
Current state | Input | Output | Next state |
|---|---|---|---|
S1 | Button-Y | Output-A | S2 |
S1 | Button-Z | Output-B | S3 |
Examiner Tips and Tricks
Always identify the initial state before tracing
Highlight or mark inputs and outputs on your diagram to avoid missing one
For tables, keep the order consistent: Input → Output → Next state
Use arrows systematically, avoid guessing paths
Remember: more than one sequence can sometimes reach the same state, but exams often ask for the minimum changes
Worked Example
Part of a program is represented by the following state‑transition diagram
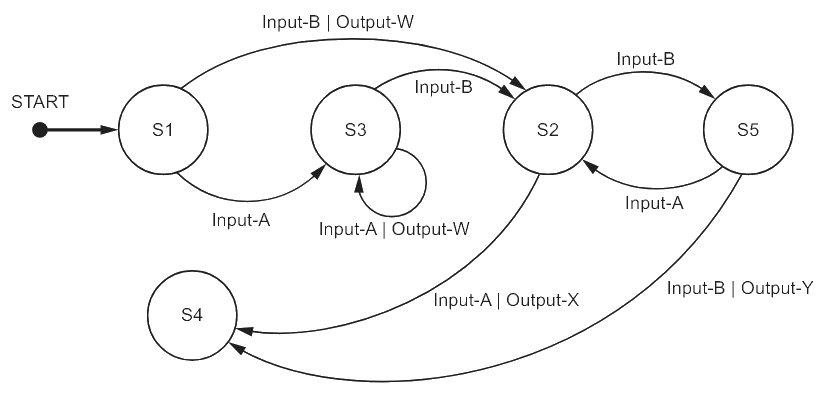
A. Complete the table to show the inputs, outputs and next states.
Assume that the current state for each row is given by the ‘Next state’ on the previous row. For example, the first Input‑A is made when in state S1.
If there is no output for a given transition, then the output cell should contain ‘none’.
The first two rows have been completed.
Input | Output | Next state |
|---|---|---|
S1 | ||
Input-A | none | S3 |
Output-W | ||
none | ||
Input-B | ||
Input-A | ||
S4 |
[5]
B. Identify the input sequence that will cause the minimum number of state changes in the transition from S1 to S4
[1]
Answers
A.
Input | Output | Next state |
|---|---|---|
S1 | ||
Input-A | none | S3 |
Input-A | Output-W | S3 |
Input-B | none | S2 |
Input-B | none | S5 |
Input-A | none | S2 |
Input-A | Output-X | S4 |
One mark per row 3 to 7 [5 marks]
B. Input-B, Input-A [1 mark]

Unlock more, it's free!
Join the 100,000+ Students that ❤️ Save My Exams
the (exam) results speak for themselves:

Was this revision note helpful?