Measuring Income & Wealth Inequality (Cambridge (CIE) A Level Economics): Revision Note

Exam code: 9708

Steve Vorster

Written by: Steve Vorster

Reviewed by: Lisa Eades

Updated on

Income

  • Income is the flow of earnings received over a period of time from the factors of production 

    • Rent, wages, interest and profit

  • Income inequality refers to differences in the distribution of income between individuals or households

  • High inequality may lead to:

    • Poverty

    • Social instability

    • Lower economic growth

Wealth

  • Wealth is the stock of assets owned at a point in time

    • E.g. Property, shares, antiques, pension schemes

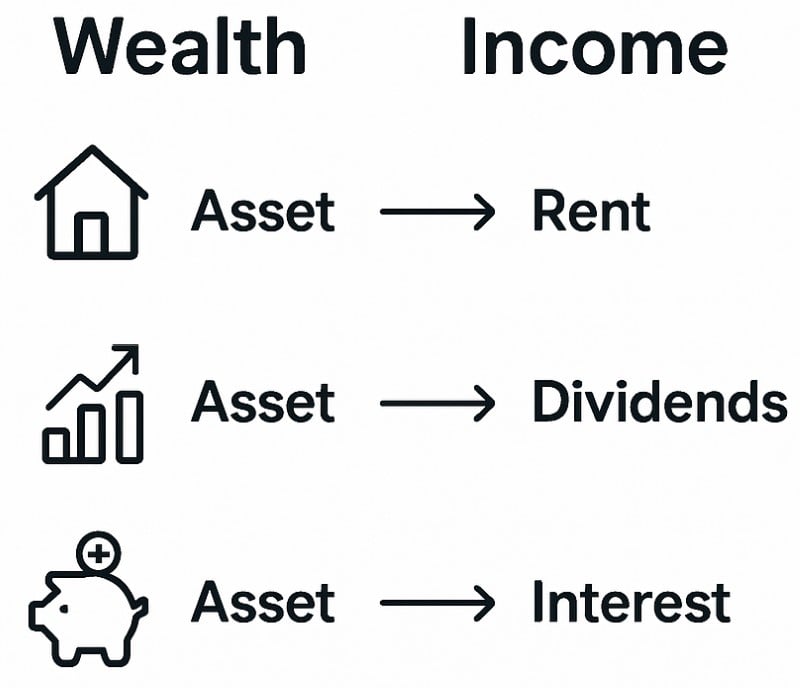
    • Assets can be used to generate a flow of income

  • Wealth inequality refers to differences in the distribution of assets between individuals or households

    • Wealth can generate income, which can increase inequality over time

Diagram showing wealth as assets generating income types: house for rent, stocks for dividends, piggy bank for interest.

The Gini coefficient

  • The Lorenz curve can be used to calculate the Gini Coefficient

Graph showing cumulative income distribution with a blue shaded curve marked 'A' and a green area marked 'B', illustrating a Lorenz curve.
The Gini Coefficient is calculated using the area beneath the line of equality   

Diagram analysis

  • Gini coefficient = A / (A + B)

  • Where:

    • A = area between the line of equality and the Lorenz curve

    • B = area under the Lorenz curve

  • A value of 0 represents absolute equality and 1 represents perfect inequality

    • In 2017, Estonia had a lower Gini coefficient (0.3) than South Africa (0.62), indicating a more equal distribution of income

  • Governments use progressive taxation and transfer payments to shift the Gini coefficient closer to zero, the line of perfect equality

Worked Example

Explain what happened to income inequality in Bolivia between 2008 and 2016 

Income Gini Coefficient Data for Bolivia

Income Gini Coefficient 2008

0.51

Income Gini Coefficient 2016

0.43

Step 1: Determine if inequality has improved or worsened  

  • The closer to zero, the closer the country is to perfect equality

  • Bolivia's inequality has improved as the Gini coefficient has fallen

  • The closer the Gini coefficient is to zero, the more equal the distribution of income is in a country

Step 2: Provide final comment

  • Bolivia's Gini coefficient has moved closer to zero, indicating that there is less income inequality in 2016 than there was in 2008

Causes of income and wealth Inequality

  • There are many causes of income and wealth inequality

Education, training and Skills

Trade unions

Welfare system

Pension payments

  • The higher the skill level the higher the level of income.

  • A country with a poor education system will see greater inequality than one with a good education system

  • Countries with strong trade union membership tend to have higher levels of income.

  • With low trade union membership, the exploitation of workers through low wages is easier

  • Countries that provide a range of benefits (such as unemployment, disability, child support, housing support etc) raise the income of the lowest 20% of the population resulting in more equal distribution

  • State pension payments ensure a minimum standard of living for retirees resulting in a more equal distribution of income.

  • Countries without it have a much higher percentage of pensioners living in poverty

Wage rates

Employment legislation

Tax structure

Asset ownership

  • The purpose of a national minimum wage is to improve the equity in the distribution of income.

  • Without a minimum wage → lower incomes for low-skilled workers → greater income inequality

  • Generally, the more workers are protected by law, the better the income distribution in an economy e.g. maternity benefits ensure that new mothers have a higher level of income during the first months of leave after a birth

  • Progressive tax systems allow all income earners to contribute to public revenue according to their ability.

  • Decreasing taxes on the lower end and increasing it on the upper end would mean that the system is more progressive and there would be a more equal distribution of income

  • Assets generate income.

  • The more equal the asset ownership in an economy the less the inequality in income distribution

  • Wealth passed across generations → increases wealth inequality

Unlock more, it's free!

Join the 100,000+ Students that ❤️ Save My Exams

the (exam) results speak for themselves:

Steve Vorster

Author: Steve Vorster

Expertise: Economics & Business Subject Lead

Steve has taught A Level, GCSE, IGCSE Business and Economics - as well as IBDP Economics and Business Management. He is an IBDP Examiner and IGCSE textbook author. His students regularly achieve 90-100% in their final exams. Steve has been the Assistant Head of Sixth Form for a school in Devon, and Head of Economics at the world's largest International school in Singapore. He loves to create resources which speed up student learning and are easily accessible by all.

Lisa Eades

Reviewer: Lisa Eades

Expertise: Business Content Creator

Lisa has taught A Level, GCSE, BTEC and IBDP Business for over 20 years and is a senior Examiner for Edexcel. Lisa has been a successful Head of Department in Kent and has offered private Business tuition to students across the UK. Lisa loves to create imaginative and accessible resources which engage learners and build their passion for the subject.