Indifference Curves & Budget Lines (Cambridge (CIE) A Level Economics): Revision Note
Exam code: 9708

Indifference curves
An indifference curve shows all the combinations of two goods that give a consumer the same level of satisfaction
If a person is equally happy with different combinations, those combinations lie on the same curve
For example, when choosing between cinema tickets and video game hours, one combination might be 2 cinema tickets and 3 hours of gaming, while another might be 3 tickets and 1 hour of gaming. If both options feel equally enjoyable, they lie on the same indifference curve
Higher indifference curves = more happiness
Rational consumers aim for the highest curve they can afford
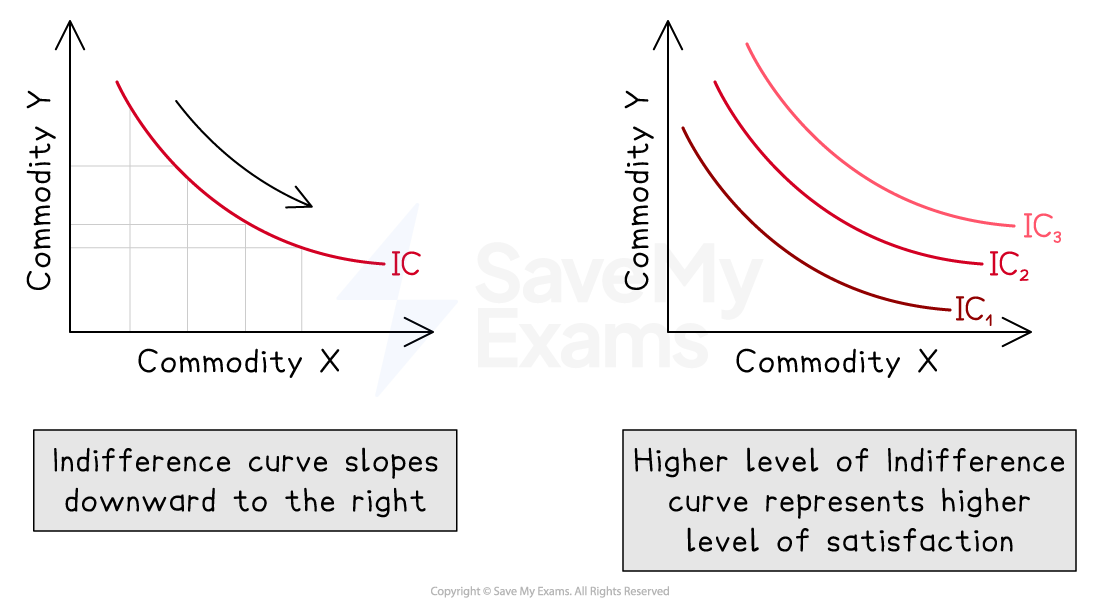
How the curve works
Indifference curves slope downwards. This means that if someone gives up one unit of a good (like a cinema ticket), they need more of the other (like gaming time) to stay just as satisfied
So if the consumer moves from 3 tickets and 1 hour of gaming to 2 tickets and 3 hours of gaming, they are still on the same curve and their happiness has not changed
Budget lines: making smart spending choices
A budget line shows all the combinations of two goods a consumer can afford, given their income and the price of the goods
It helps explain how people make choices when their money is limited
Worked Example
Imagine a student has £100 to spend on two goods they enjoy:
Books at £20 each
Cinema tickets at £10 each
The budget line includes every combination of books and tickets that adds up to exactly £100
If they spend all their money on books, they can buy 5
If they spend it all on cinema tickets, they can buy 10
Any mix in between involves giving up some of one to gain more of the other
Books (£20 each) | Cinema Tickets (£10 each) |
|---|---|
5 | 0 |
4 | 2 |
3 | 4 |
2 | 6 |
1 | 8 |
0 | 10 |
Each row shows a different way the student could spend their £100
The budget line connects these combinations on a graph, showing the trade-off between the two goods

Analysis
The slope of the budget line reflects the relative price of books and tickets
A movement along the line means choosing a different mix of the two items
If income or prices change, the budget line shifts, allowing more or fewer combinations
This concept helps explain how consumers balance their spending to get the most satisfaction from their money
What shifts the budget line?
If income decreases the whole line shifts inward from BL1 to BL2 as less of both goods can be bought
If the price of cinema tickets increases, the line pivots inward from BL1 to BL3 on the cinema tickets axis, as less tickets can be bought with the same income

Examiner Tips and Tricks
You should remember that a change in income creates a parallel shift
A change in the price of one good causes the budget line to pivot around the axis of the good whose price has not changed
Limitations of the indifference curve model
While indifference curves are useful for showing how consumers choose between two goods, the model has several real-world limitations
1. Real-life choices involve more than two goods
In reality, consumers do not just choose between two items. A student deciding how to spend their weekly allowance might be weighing up clothes, snacks, streaming subscriptions, school supplies, and transport costs, not just two items
2. People often express preferences, not indifference
The term “indifference” suggests that a person is equally happy with any combination of the two goods on the curve
Consumers tend to have clear preferences. For example, one student might strongly prefer three cinema tickets and one book over two books and one cinema ticket, even if both combinations lie on the same curve
This challenges the idea that people are truly indifferent between combinations
3. Consumers do not always behave rationally
Indifference curves assume that people make logical decisions to maximise their satisfaction. Real behaviour does not always follow this pattern
A student might spend all their money on limited-edition trainers even if they need school supplies. They might impulsively buy concert tickets instead of saving for a trip
Emotional decisions, peer pressure, and habits often override rational thinking

Unlock more, it's free!
Join the 100,000+ Students that ❤️ Save My Exams
the (exam) results speak for themselves:

Was this revision note helpful?
