Patterns and Trends in (Un)employment (Cambridge (CIE) A Level Economics): Revision Note
Exam code: 9708

Patterns and trends in (un)employment
Unemployment is rarely spread evenly across an economy
Certain groups, regions, and time periods consistently experience higher rates
Observing these patterns (across groups) and trends (over time) helps identify which types of unemployment are dominant and where policy should be targeted
Key patterns in unemployment
Pattern | What it shows | Link to type of unemployment |
|---|---|---|
Youth unemployment typically 2-3× adult rate |
|
|
Regional disparities within countries |
|
|
Gender gaps |
|
|
Skill-level gaps |
|
|
Ethnic/minority gaps |
|
|
Long-term unemployment (>12 months) rising in advanced economies |
|
|
Key trends over time
Cyclical fluctuations - unemployment rises in recessions and falls in expansions (e.g. 2008-09 financial crisis, 2020 COVID shock)
Structural shifts - decline of manufacturing employment in advanced economies; rise of service and digital sectors
Rising labour force participation of women in most economies since 1970s
Falling participation of older men in some advanced economies (earlier retirement)
Growth of "non-standard" work - part-time, temporary, gig-economy contracts — complicates unemployment measurement
Automation and AI - emerging trend raising concerns about displacement of routine jobs
Examiner Tips and Tricks
When reading unemployment data in a data response question, always check:
Headline vs specific rates - overall rate may hide high youth, regional or gender-specific rates
Direction of change - is unemployment rising, falling or stable?
Participation rate - a falling unemployment rate can mean more jobs OR that discouraged workers have left the labour force
Long-term share - rising share of long-term unemployed signals hysteresis risk
Comparisons - across countries, regions or time periods to spot patterns
Case Study
Youth unemployment in the Eurozone after 2008
The context
The 2008 global financial crisis hit Eurozone economies hard. Youth unemployment (15-24 age group) rose far more sharply than adult rates across the region.
The pattern
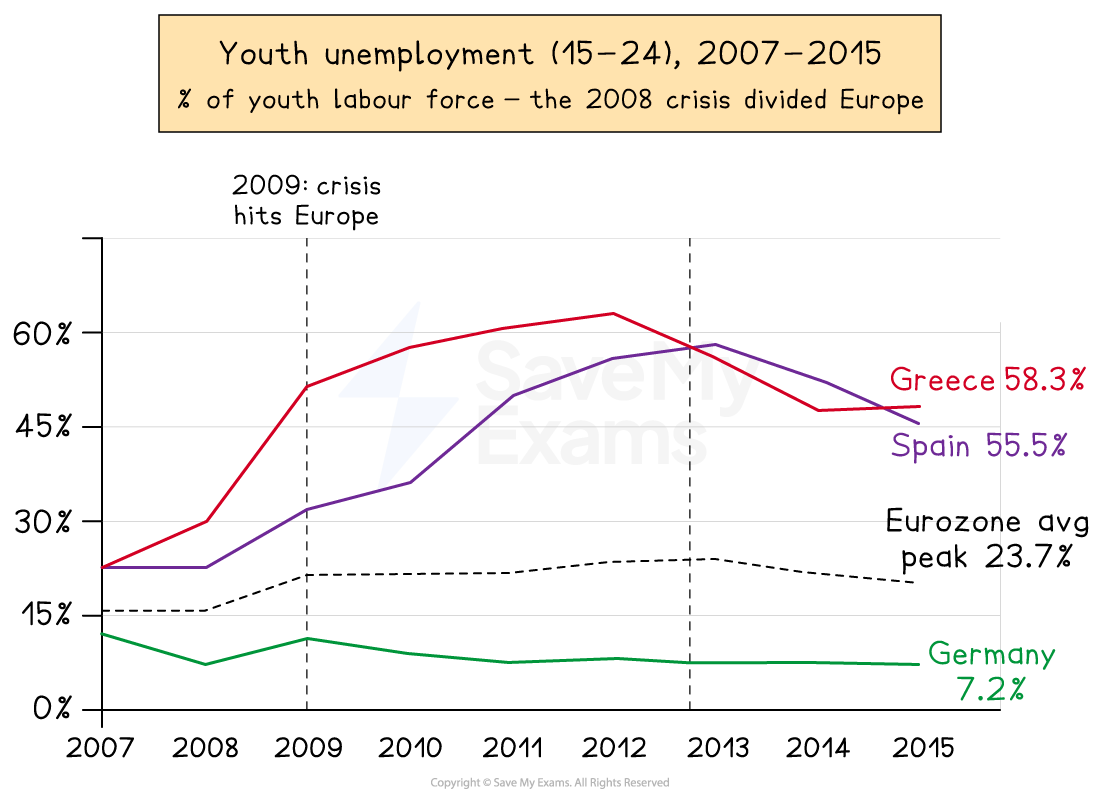
Eurozone youth unemployment rose from ~15% (2007) to a peak of ~24% (2013)
Spain and Greece experienced extreme peaks — above 55% in 2013
Germany remained an outlier — youth unemployment stayed below 8% throughout
The youth-to-adult ratio exceeded 3:1 across most Southern European economies
What this illustrates
Cyclical component - youth are the "first out" when demand falls (fixed-term contracts, last hired)
Structural component - skills mismatch; dual labour markets (protected insiders vs precarious outsiders)
Regional divergence - Germany's dual training system (apprenticeships + vocational schools) produced better matching, showing the role of structural factors
Hysteresis risk - long spells of youth unemployment create long-lasting "scarring" effects on future earnings
Examiner Tips and Tricks
For data response questions on unemployment patterns (often drawing on ILO, World Bank or OECD data), always identify which type of unemployment the data illustrates - youth unemployment is largely frictional and structural, regional disparities point to immobility, rising long-term unemployment signals hysteresis.
Never describe data without linking it to a specific type. When comparing countries or time periods, comment on both the level and the direction of change - a high but falling rate tells a different story from a moderate but rising one.

Unlock more, it's free!
Join the 100,000+ Students that ❤️ Save My Exams
the (exam) results speak for themselves:

Was this revision note helpful?
