Inflationary & Deflationary Gaps (Cambridge (CIE) A Level Economics): Revision Note
Exam code: 9708

Bridge to the multiplier and components of AD
The multiplier process established how an injection changes equilibrium national income
The components of AD explained what drives the level of autonomous and induced spending
This topic connects those two ideas to a crucial distinction: the equilibrium level of national income (where AE = Y) is not the same as the full employment level of national income (where all available resources are employed)
The gap between them is measured as either an inflationary gap or a deflationary gap, and it determines what kind of policy response is appropriate
Equilibrium income versus full employment income
Equilibrium national income (Y) is the level of output at which aggregate expenditure equals national income
The economy settles here in the absence of policy changes
Full employment level of national income (Y_FE) is the level of output at which all the economy's resources are fully employed
There is no cyclical unemployment and no spare capacity
These two levels may coincide, but in general they do not
When equilibrium Y is below Y_FE there is a deflationary gap
When equilibrium AE exceeds what the economy can produce at Y_FE there is an inflationary gap
The deflationary (recessionary) gap
A deflationary gap exists when the equilibrium level of national income lies below the full employment level
At Y_FE, aggregate expenditure is insufficient to buy all the output the economy is capable of producing
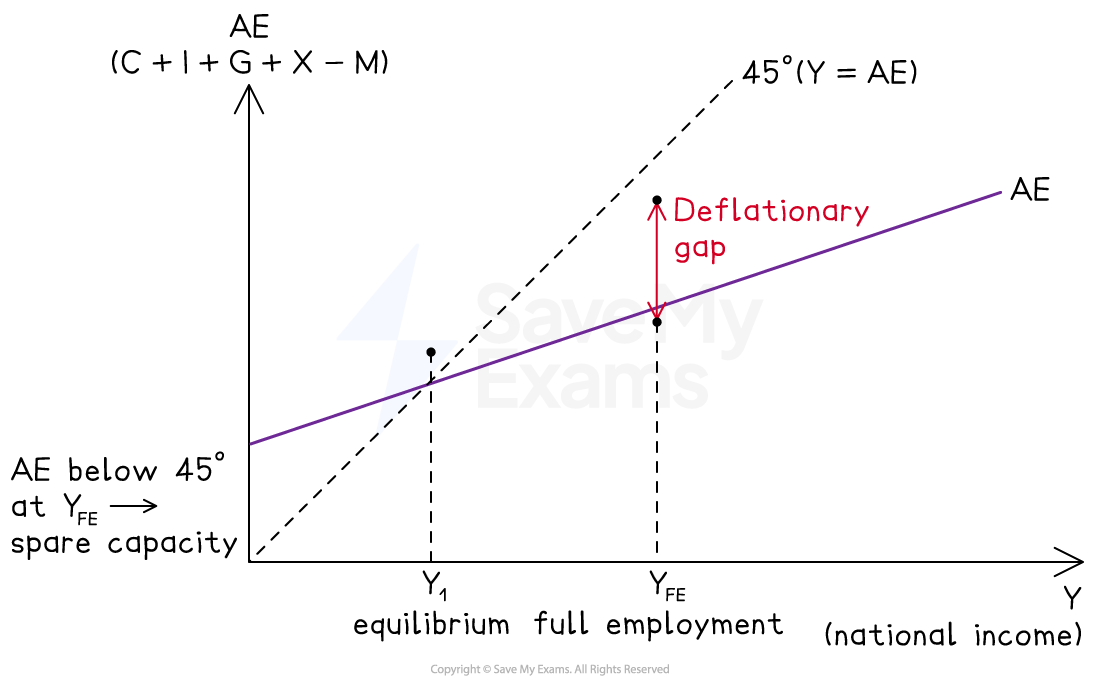
Diagram analysis
Equilibrium national income is at Y₁, where the AE curve crosses the 45° line
The full employment level of income is at Y_FE, to the right of Y₁
At Y_FE, aggregate expenditure is below the 45° line
Planned spending is less than the output the economy can produce at full employment
The deflationary gap is the vertical distance between the 45° line and the AE curve at Y_FE
It measures the amount by which AE would need to rise to bring equilibrium Y up to Y_FE
Because equilibrium Y is below Y_FE, the economy has spare capacity and cyclical unemployment
Closing the deflationary gap requires an upward shift in AE, typically through expansionary fiscal policy, expansionary monetary policy or a rise in exports
Deflationary gap on the AD/AS diagram: the negative output gap
The same situation can be shown on an AD/AS diagram
Where the deflationary gap measures the shortfall in planned expenditure, the negative output gap measures the resulting shortfall in real output
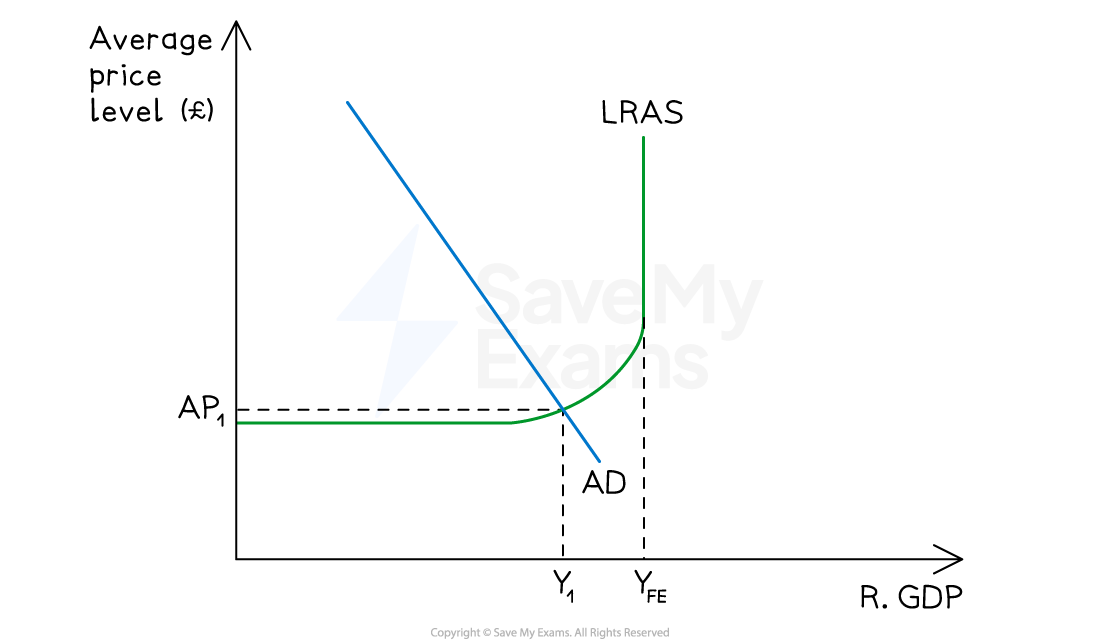
Diagram analysis
The potential (full employment) output of the economy is at Y_FE, shown by the vertical LRAS curve
Short-run equilibrium is at AP₁Y₁, where AD intersects SRAS to the left of Y_FE
The negative output gap is the horizontal distance Y₁ − Y_FE, showing actual output is below potential output
The economy has spare capacity in the short run - firms can expand output without significant pressure on prices
This situation typically arises when AD has fallen, for example due to a collapse in consumer confidence, a tightening of credit or a fall in exports
Rising unemployment and slow economic growth are indicators that a negative output gap is widening
The inflationary gap
An inflationary gap exists when aggregate expenditure exceeds the output the economy can produce at full employment
Equilibrium Y cannot physically rise above Y_FE, so the excess demand instead generates demand-pull inflation
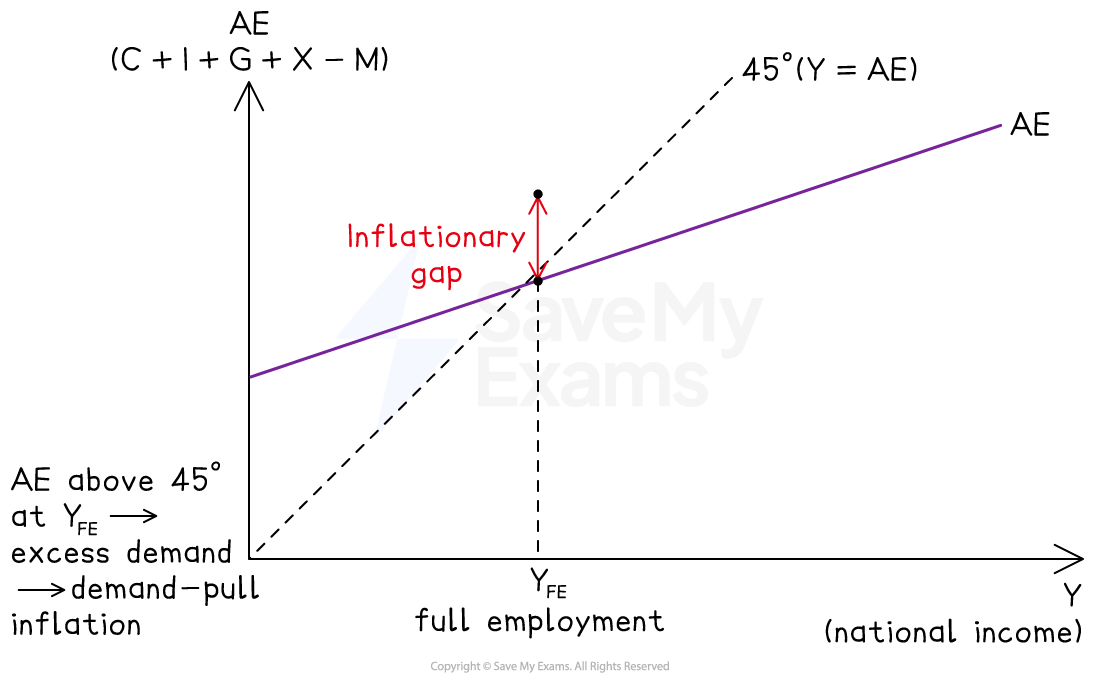
Diagram analysis
The full employment level of income is at Y_FE
At Y_FE, the AE curve lies above the 45° line
Planned expenditure exceeds the output the economy is capable of producing
The inflationary gap is the vertical distance between the AE curve and the 45° line at Y_FE
It measures the amount by which AE would need to fall to eliminate excess demand
Because the economy cannot produce more than Y_FE, the excess demand pushes up the average price level rather than raising real output
This is demand-pull inflation
Closing the inflationary gap requires a downward shift in AE, typically through contractionary fiscal policy, contractionary monetary policy or measures that reduce net exports
Inflationary gap on the AD/AS diagram: the positive output gap
On an AD/AS diagram, the inflationary gap corresponds to a short-run equilibrium at which real output temporarily exceeds the economy's sustainable capacity
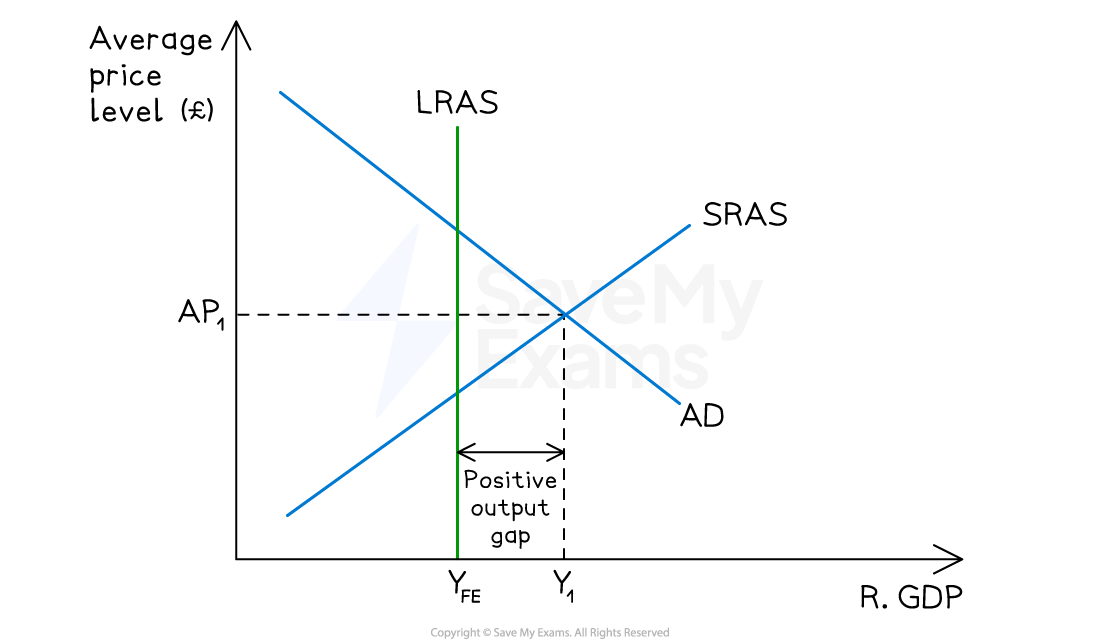
Diagram analysis
The potential output of the economy is at Y_FE, shown by the vertical LRAS curve
Short-run equilibrium is at AP₁Y₁, where AD intersects SRAS to the right of Y_FE
The positive output gap is the horizontal distance Y_FE − Y₁, showing actual output is above sustainable potential output
The economy is operating beyond its long-run capacity in the short run
Workers may be working overtime, machines operating at unsustainable intensity, and unemployment below the natural rate
This situation is not sustainable: rising costs and input shortages push SRAS leftward until the positive output gap is eliminated
Rapidly rising prices are a key indicator that a positive output gap is developing
Keynesian and Classical views on how gaps close
The two schools disagree on whether gaps close automatically without policy intervention
View | Deflationary gap | Inflationary gap |
|---|---|---|
Classical |
|
|
Keynesian |
|
|
The policy implication is significant
If the Keynesian view is correct, a deflationary gap requires active government intervention (expansionary fiscal and monetary policy) rather than being left to self-correct
Difficulties in measuring gaps
Both types of gap are hard to measure accurately because:
The true full employment level of national income Y_FE cannot be directly observed
It must be estimated from indicators such as unemployment rates, capacity utilisation and inflation
Estimates of Y_FE are revised regularly as new data emerge
Rapidly rising prices can indicate a positive output gap is developing, but may also reflect cost-push pressures unrelated to demand
Rising unemployment and a slowdown in growth can indicate a widening negative output gap, but may also reflect structural changes in the economy
This measurement uncertainty means that policymakers face a real risk of responding to the wrong diagnosis
Tightening policy when the economy actually has spare capacity, or loosening policy when the economy is already overheating
Examiner Tips and Tricks
The most common error is confusing the size of the gap with its direction. A deflationary gap needs AE to rise to close it; an inflationary gap needs AE to fall.
Writing "deflationary gap" and then describing excess demand (or vice versa) is a guaranteed loss of marks. Anchor the terminology to what the economy needs: deflationary means AE is too deflated (too low), inflationary means AE is too inflated (too high).
Be precise about the two levels of Y. Strong answers distinguish clearly between the equilibrium level (where AE = Y, which the economy reaches on its own) and the full employment level (where all resources are employed). A gap exists precisely because these two levels differ - stating this explicitly frames the rest of the answer cleanly.
For top-band evaluation, acknowledge the Keynesian-Classical divide on how gaps close. The policy implication - whether intervention is needed or whether the economy self-corrects - is one of the most important debates in macroeconomics and connects directly to topic 10 on macroeconomic intervention. Candidates who can identify which view underpins a particular policy recommendation consistently reach Level 4.

Unlock more, it's free!
Join the 100,000+ Students that ❤️ Save My Exams
the (exam) results speak for themselves:

Was this revision note helpful?
