Comparing Growth Rates & Living Standards (Cambridge (CIE) A Level Economics): Revision Note
Exam code: 9708

Comparison over time
Comparing a country's economic growth and living standards over time requires real GDP per capita figures adjusted for inflation
Nominal figures are misleading because rising prices can increase GDP without any increase in output or welfare
Even real GDP per capita can give a distorted picture over time because:
The composition of output changes
A country that shifts spending from consumer goods to military production may show rising GDP but falling welfare
Population distribution changes
Rising GDP per capita does not reveal whether gains are concentrated among the wealthy or shared broadly
Non-marketed activity changes
As economies formalise, activity previously outside GDP enters the measured economy, inflating apparent growth
Environmental degradation accumulates
Sustained growth may be achieved at the cost of resource depletion and pollution not captured in GDP figures
The most reliable time-series comparisons use PPP-adjusted real GNI per capita alongside non-monetary indicators such as life expectancy and literacy to check whether income gains are translating into genuine welfare improvements
Comparisons between countries
Comparing living standards across countries requires additional adjustments beyond real GDP per capita
Adjustment | Explanation |
|---|---|
PPP adjustment |
|
Income distribution |
|
Non-monetary indicators |
|
Informal economy size |
|
Case Study
Comparing economic growth and living standards in Vietnam and Philippines, 1995–2023
The context
Vietnam and the Philippines are both Southeast Asian economies with populations of around 100 million and comparable development levels in the mid-1990s
Both experienced significant GDP growth over three decades yet produced markedly different living standard outcomes, illustrating why growth rates alone are insufficient for comparing welfare.
Actions taken
Vietnam pursued export-oriented manufacturing following its Doi Moi reforms, attracting FDI into electronics, textiles and footwear - growth broadly distributed across the workforce and supported by public investment in healthcare and education
The Philippines relied more heavily on remittances and business process outsourcing - a model that raised incomes for a relatively narrow urban and skilled segment while leaving agricultural and informal workers behind
Outcomes
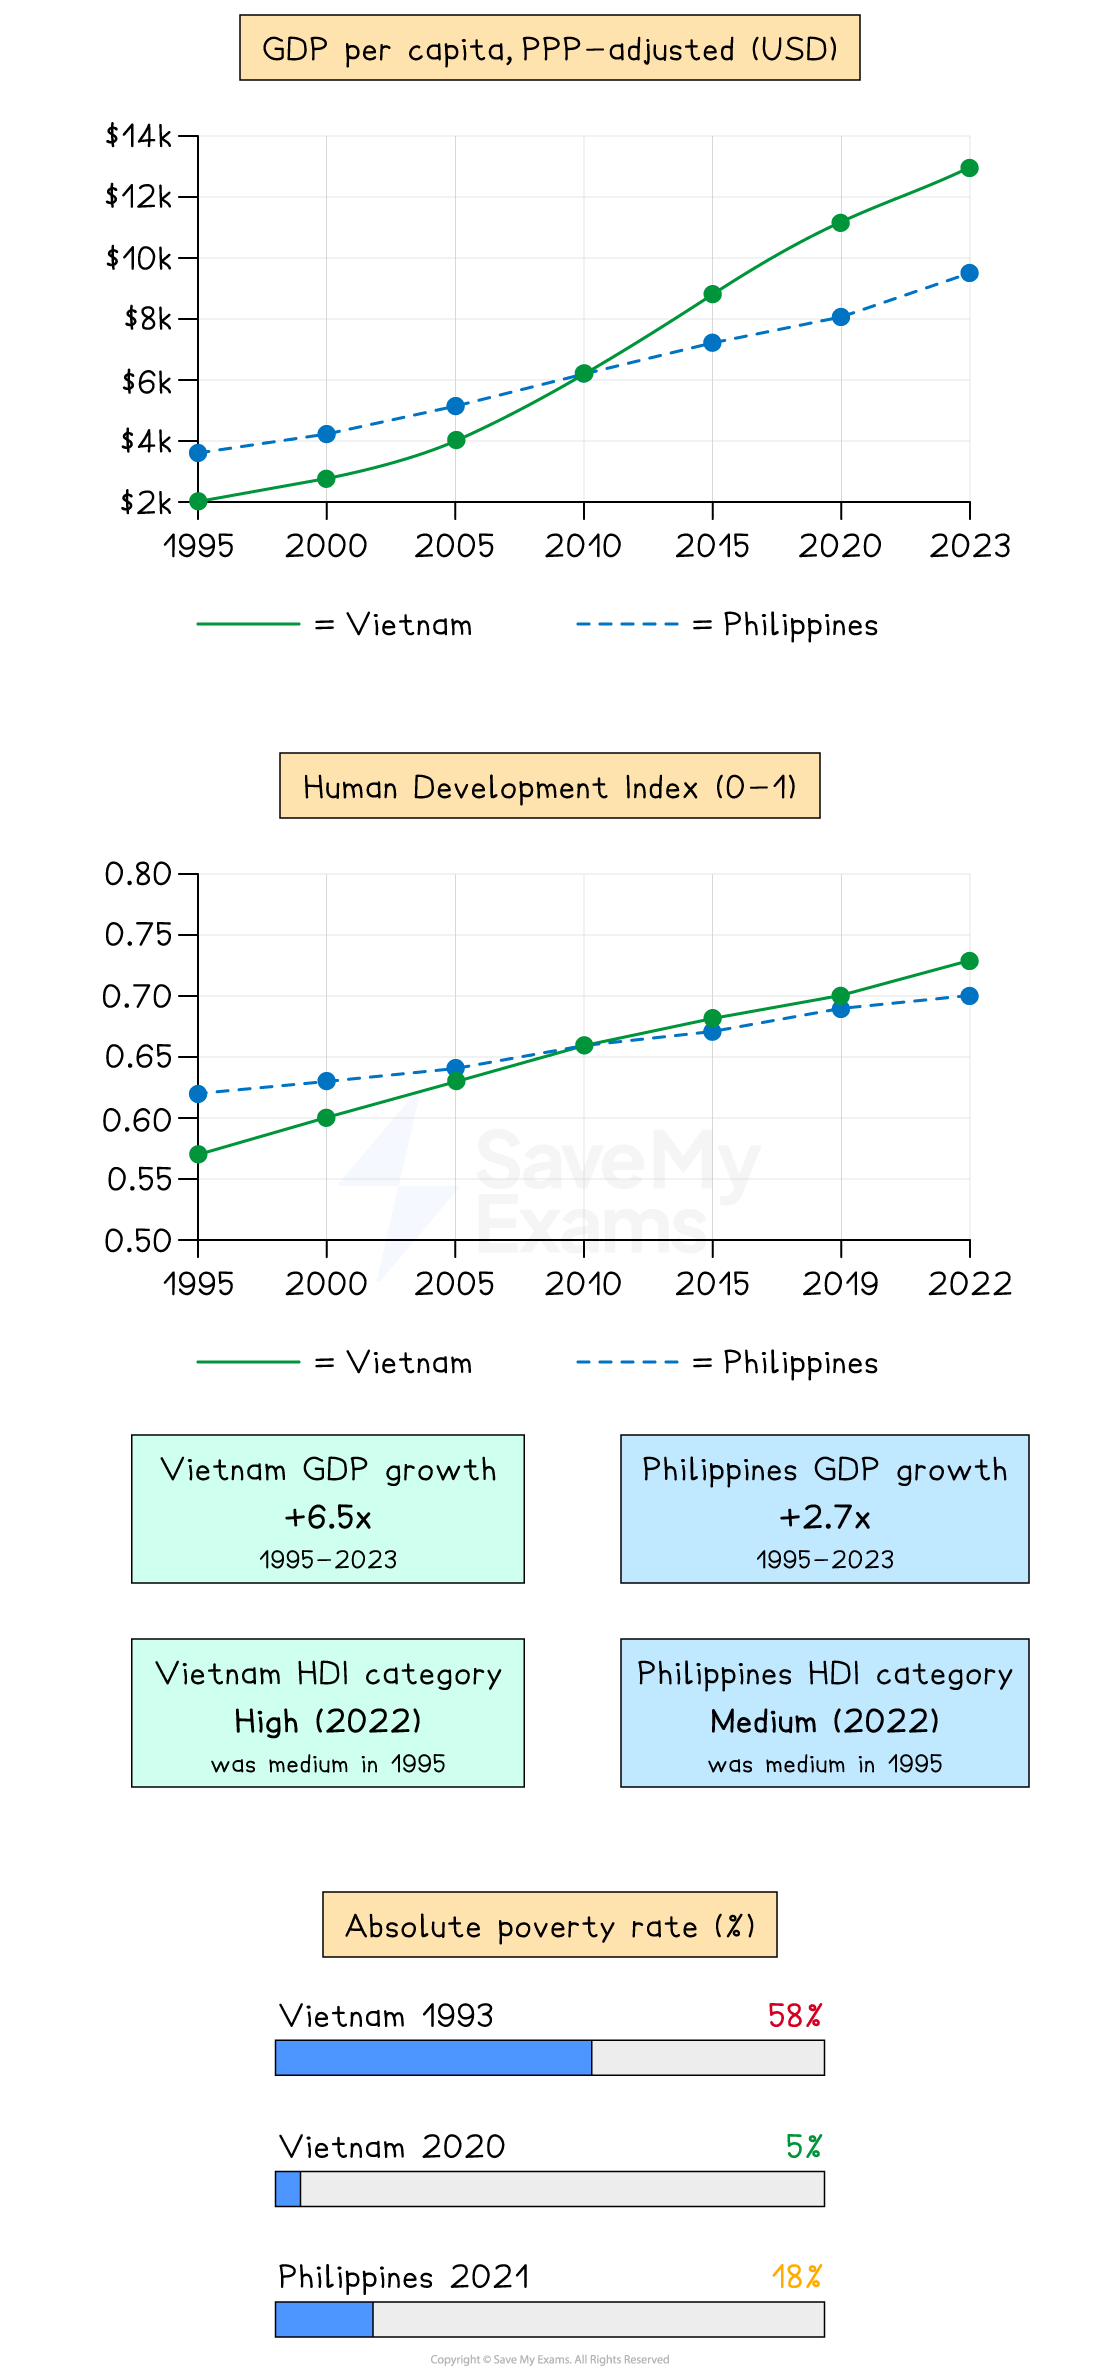
Vietnam's PPP-adjusted GDP per capita rose from approximately $2,000 in 1995 to over $13,000 by 2023
The Philippines rose from $3,500 to $9,500 - Vietnam started lower but ended higher
Vietnam's HDI reached 0.73 by 2022, crossing into the high human development category
The Philippines reached 0.70, remaining in the medium category despite starting ahead
Vietnam's absolute poverty rate fell from 58% in 1993 to under 5% by 2020
The Philippines remained above 18% as recently as 2021
The case shows that broad-based manufacturing employment produces faster poverty reduction than growth concentrated in high-skill services and remittances - and that starting income level is not a reliable predictor of future welfare outcomes

Unlock more, it's free!
Join the 100,000+ Students that ❤️ Save My Exams
the (exam) results speak for themselves:

Was this revision note helpful?
