Types of Unemployment and the Natural Rate (Cambridge (CIE) A Level Economics): Revision Note
Exam code: 9708

Key terms
Working-age population - all people of employable age (typically 16–64)
Labour force (LF) - those in the working-age population who are either employed OR actively seeking work
Excludes students, retirees, homemakers, and others not seeking work (the "economically inactive")
Employed - people currently working for pay (full-time, part-time, or self-employed)
Unemployed - people in the labour force who are not working but actively seeking work
Participation rate - labour force as a % of working-age population
Unemployment rate - unemployed as a % of labour force
Full employment
Full employment is the level of employment at which everyone willing and able to work at the going wage rate is employed
Full employment does NOT mean zero unemployment
Some unemployment always remains due to frictional, structural and voluntary factors
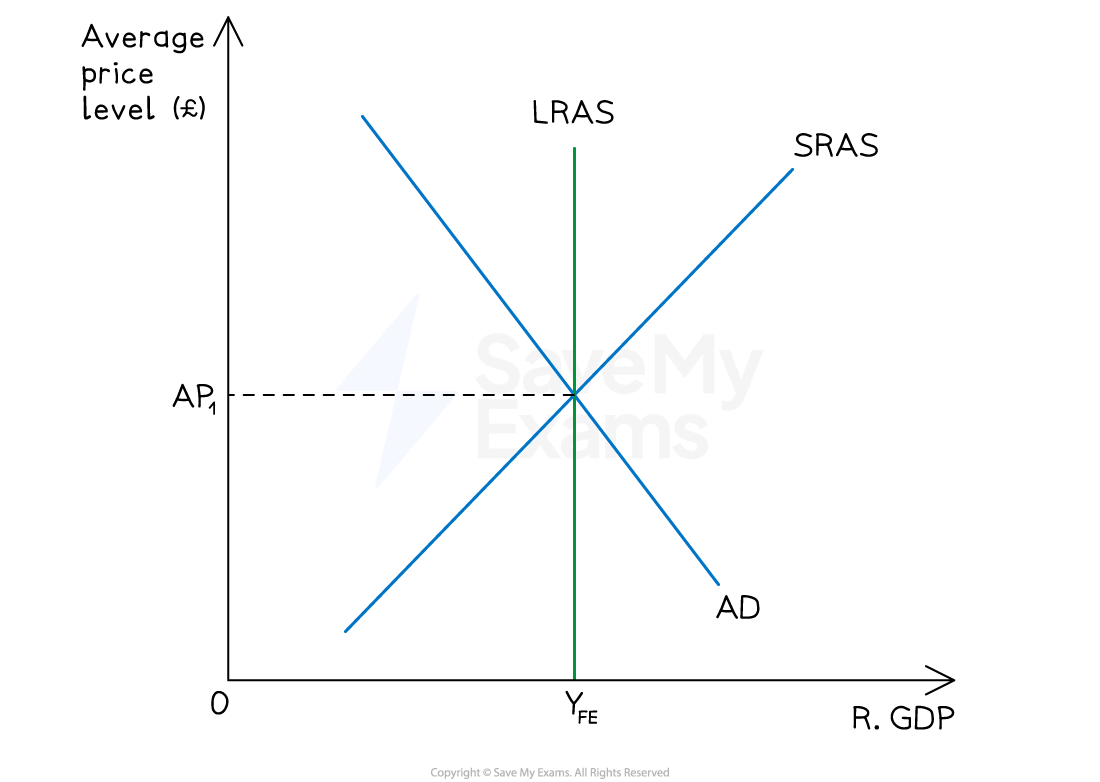
At full employment, the only unemployment is the natural rate of unemployment (NRU)
This corresponds to real output YFE on the vertical section of LRAS
Equilibrium and disequilibrium unemployment
Type | Cause | Examples |
|---|---|---|
Equilibrium unemployment |
|
|
Disequilibrium unemployment |
|
|
Equilibrium unemployment
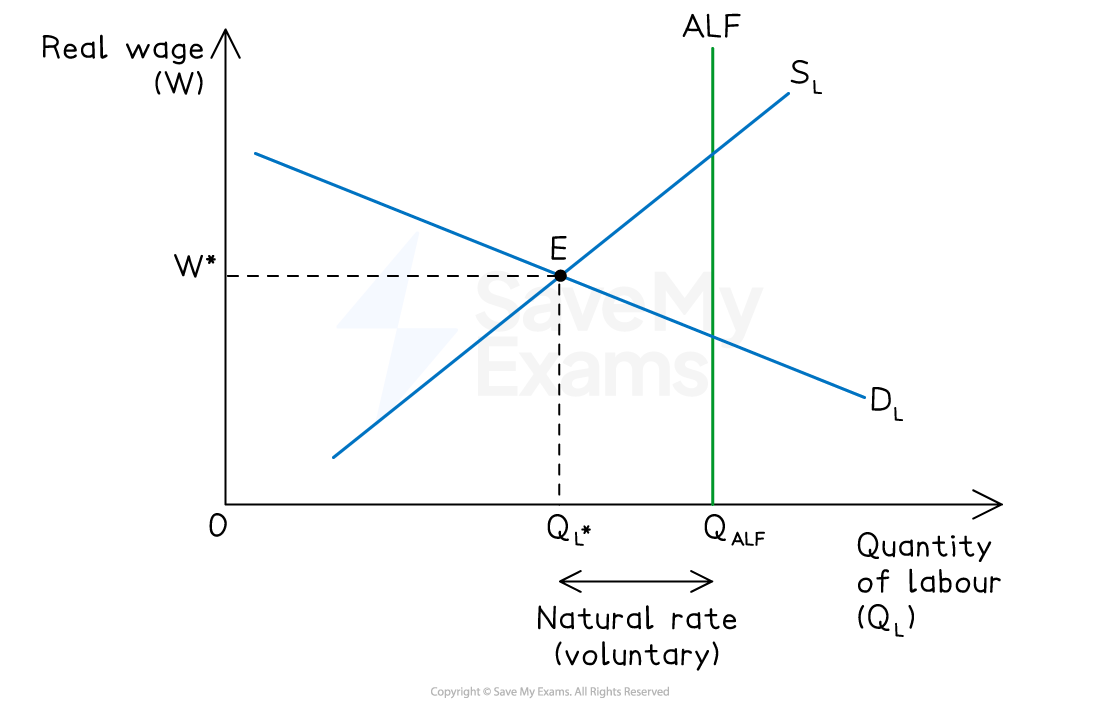
Diagram analysis
DL (downward sloping) - firms hire more workers at lower wages
SL (upward sloping) - more workers willing to work at higher wages
LF (vertical) - everyone who could potentially work (labour force)
Equilibrium at W*, QL* - labour market clears
Horizontal gap between SL and LF at W* = natural rate of unemployment
This is voluntary as workers are in the labour force but not willing to work at W*
Hysteresis
Hysteresis is the tendency of unemployment to persist at higher levels after a temporary shock has passed
Long-term unemployed lose skills (human capital erodes)
Employers view them as less employable (signalling effect)
Discouraged workers stop searching
Consequence - a cyclical shock can permanently raise the natural rate of unemployment unless addressed through active labour market policy
Example - European unemployment rose sharply after the 1980s oil shocks and remained elevated for over a decade, even after recovery
Voluntary and involuntary unemployment
Type | Definition | Typical cause | Part of |
|---|---|---|---|
Voluntary |
|
|
|
Involuntary |
|
|
|
Involuntary/disequilibrium unemployment
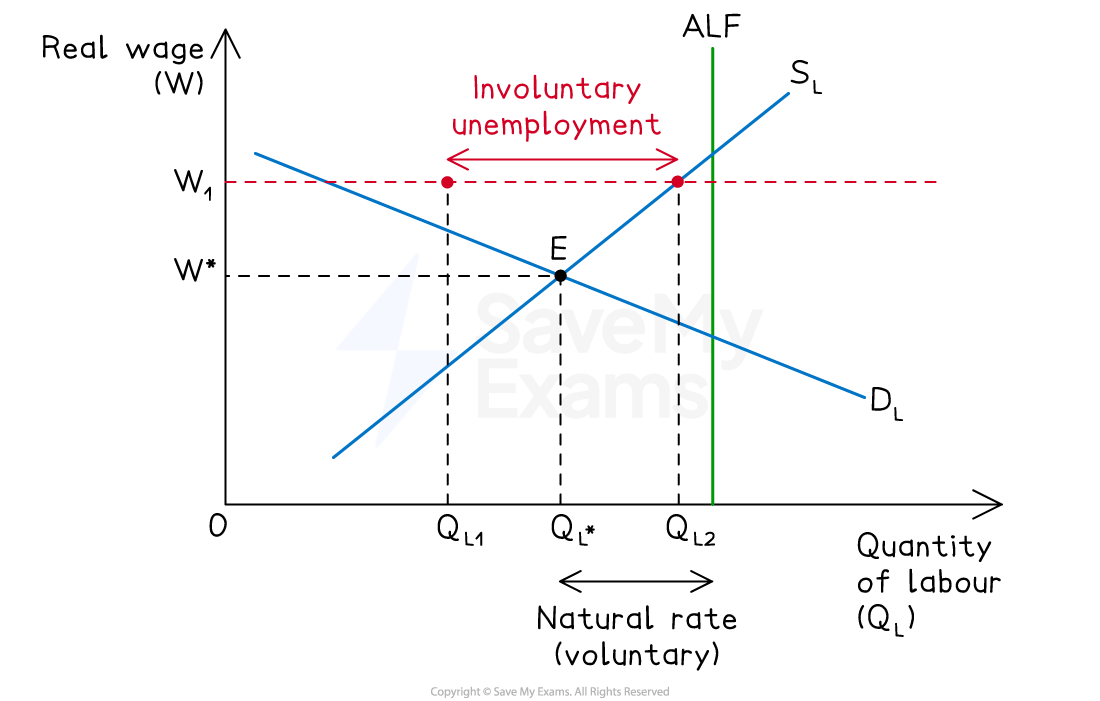
Diagram analysis
The real wage is stuck at W₁ above equilibrium W* (e.g. due to minimum wage, union action, or sticky nominal wages)
At W₁, firms demand only Q_L1 workers, but Q_L2 workers are willing to work
Gap between QL1 and QL2 = involuntary unemployment
Workers are ready and able to work at W₁ but cannot find jobs
The natural rate of unemployment (NRU)
The NRU is the rate of unemployment when the labour market is in equilibrium
This corresponds to full employment output YFE
It comprises frictional + structural + voluntary unemployment
The NRU cannot be reduced permanently by expansionary demand-side policy
Doing so only creates inflation (see expectations-augmented Phillips curve)
Determinants of the NRU
Factor | Effect on NRU |
|---|---|
Unemployment benefit generosity |
|
Labour market regulation (unions, employment protection) |
|
Skills and training |
|
Geographic and occupational mobility |
|
Job-matching efficiency (job centres, technology) |
|
Rate of technological change |
|
Policy implications
Demand-side policies (fiscal, monetary) cannot reduce unemployment below the NRU in the long run - they only cause inflation
Reducing the NRU requires supply-side policies:
Education and retraining to reduce structural mismatch
Job-search support and improved labour exchanges
Benefit reform to reduce disincentives
Increasing labour mobility
Examiner Tips and Tricks
Always distinguish equilibrium and disequilibrium unemployment clearly in your opening paragraph — equilibrium unemployment is voluntary (workers choosing not to work at W*) and forms the NRU; disequilibrium unemployment is involuntary (workers wanting work but unable to find it at a sticky wage).
Draw both labour market diagrams where the question demands a comparison - a single diagram cannot show both cases.
For questions on why expansionary demand-side policy cannot permanently reduce unemployment, link directly to the expectations-augmented Phillips curve - AD stimulus reduces unemployment below the NRU in the short run but raises inflation. Once workers adjust wage expectations upward, unemployment returns to the NRU at a higher inflation rate.
Hysteresis is a high-value AO3 evaluation point - it explains why recessions can have permanent effects and why active labour market policies (training, job-search support) are justified even after the immediate shock has passed.

Unlock more, it's free!
Join the 100,000+ Students that ❤️ Save My Exams
the (exam) results speak for themselves:

Was this revision note helpful?
