Economic Structure (Cambridge (CIE) A Level Economics): Revision Note
Exam code: 9708

Employment in primary, secondary and tertiary sectors
Primary sector is defined as economic activity involving the direct extraction or harvesting of natural resources - including agriculture, fishing, forestry, mining and quarrying
Secondary sector is defined as economic activity involving the processing of raw materials and the manufacture of goods - including construction, manufacturing and energy production
Tertiary sector is defined as economic activity involving the provision of services - including retail, finance, transport, healthcare, education and tourism
Some classifications also identify a quaternary sector covering knowledge-intensive activities such as research and development, information technology and consultancy, though this is not required at this syllabus level
Employment composition and level of development
The share of employment in each sector changes predictably as an economy develops - this pattern is sometimes referred to as the structural transformation of an economy
Low-income economies are typically characterised by a large primary sector, particularly subsistence and smallholder agriculture, which may account for 50–80% of employment

As economies industrialise, employment shifts from the primary to the secondary sector
Manufacturing absorbs rural labour moving into cities, raising productivity and wages
Advanced high-income economies are dominated by the tertiary sector, which typically accounts for over 70% of employment
The primary sector shrinks to a very small share as agricultural productivity rises and manufacturing relocates or automates
Development stage | Primary | Secondary | Tertiary |
|---|---|---|---|
Low-income |
|
|
|
Middle-income |
|
|
|
High-income |
|
|
|
Limitations of the three-sector model
The boundaries between sectors are not always clear
Agro-processing sits between primary and secondary
Financial services linked to commodity exports blur further distinctions
Employment shares do not capture productivity differences
A small but highly productive agricultural sector in a high-income economy contributes more value per worker than a large low-productivity sector elsewhere
The informal economy, which is large in low-income countries, is often underrepresented in official employment statistics, distorting apparent sector shares
Worked Example
Which row shows characteristics of a fast-growing economy?
GDP per capita | Birth rate | Household saving ratio | |
|---|---|---|---|
A | falling | falling | rising |
B | falling | rising | falling |
C | rising | falling | rising |
D | rising | rising | falling |
Answer: C
Option C correctly combines rising GDP per capita with falling birth rate and rising saving ratio - the classic profile of a mid-development economy in structural transformation
A fast-growing economy would see rising GDP per capita as output expands faster than population — this eliminates options A and B immediately
Worked solution
Between C and D, the key distinction is the birth rate and saving ratio: a fast-growing economy undergoing structural transformation typically experiences a falling birth rate (as urbanisation and female education rise) and a rising household saving ratio (as incomes grow and households accumulate capital for investment)
Option D is incorrect — rising birth rates are associated with lower-income, pre-industrial economies; a fast-growing economy typically already shows demographic transition with birth rates declining
Pattern of trade at different levels of development
The composition and direction of a country's trade changes significantly with its level of development
This reflects shifts in factor endowments, productivity, and comparative advantage
Low-income economies
Trade is typically dominated by primary commodity exports - agricultural products, minerals, timber and fuels - which are produced using the abundant factor of unskilled labour and natural resources
Imports tend to consist of manufactured goods, capital equipment and technology that cannot be produced domestically
This pattern creates vulnerability to commodity price volatility - primary commodity prices are subject to large swings, meaning export revenues and government income can be highly unstable
Middle-income economies
As industrialisation proceeds, the export mix shifts towards labour-intensive manufactured goods - clothing, footwear, basic electronics and assembled products
Export earnings become more stable and less dependent on a single commodity
Imports shift towards more sophisticated capital goods, intermediate inputs and services required for further industrial development
Countries may pursue export-led growth strategies - actively orienting manufacturing towards global markets as a driver of income growth; South Korea, Taiwan and Vietnam are frequently cited examples
High-income economies
Trade is dominated by high-value manufactured goods and knowledge-intensive services, such as financial services, insurance, business consulting, software and intellectual property
Intra-industry trade becomes significant - countries both export and import similar categories of goods, reflecting product differentiation and economies of scale rather than simple factor endowments
Trade in services grows as a share of total trade - in the most advanced economies services can account for a larger share of export earnings than goods
Key implications of trade pattern differences
Low-income | Middle-income | High-income | |
|---|---|---|---|
Main exports |
|
|
|
Main imports |
|
|
|
Terms of trade risk |
|
|
|
Diversification |
|
|
|
Value added per export dollar |
|
|
|
Case Study
Nigeria vs South Korea
Pattern of trade at different levels of development
The context
Nigeria and South Korea had broadly comparable GDP per capita in the early 1960s. Over the following six decades their trade patterns diverged dramatically, making them a compelling contrast between commodity-dependent and export-led industrial development.
Actions taken
Nigeria remained heavily reliant on oil exports following the discovery of crude oil in the late 1950s - by the 2010s petroleum accounted for over 90% of export earnings, with manufactured goods and services contributing very little
South Korea pursued a deliberate export-led industrialisation strategy from the 1960s, shifting from low-value exports such as textiles into electronics, shipbuilding, steel and automobiles through targeted industrial policy and investment in human capital
Outcomes
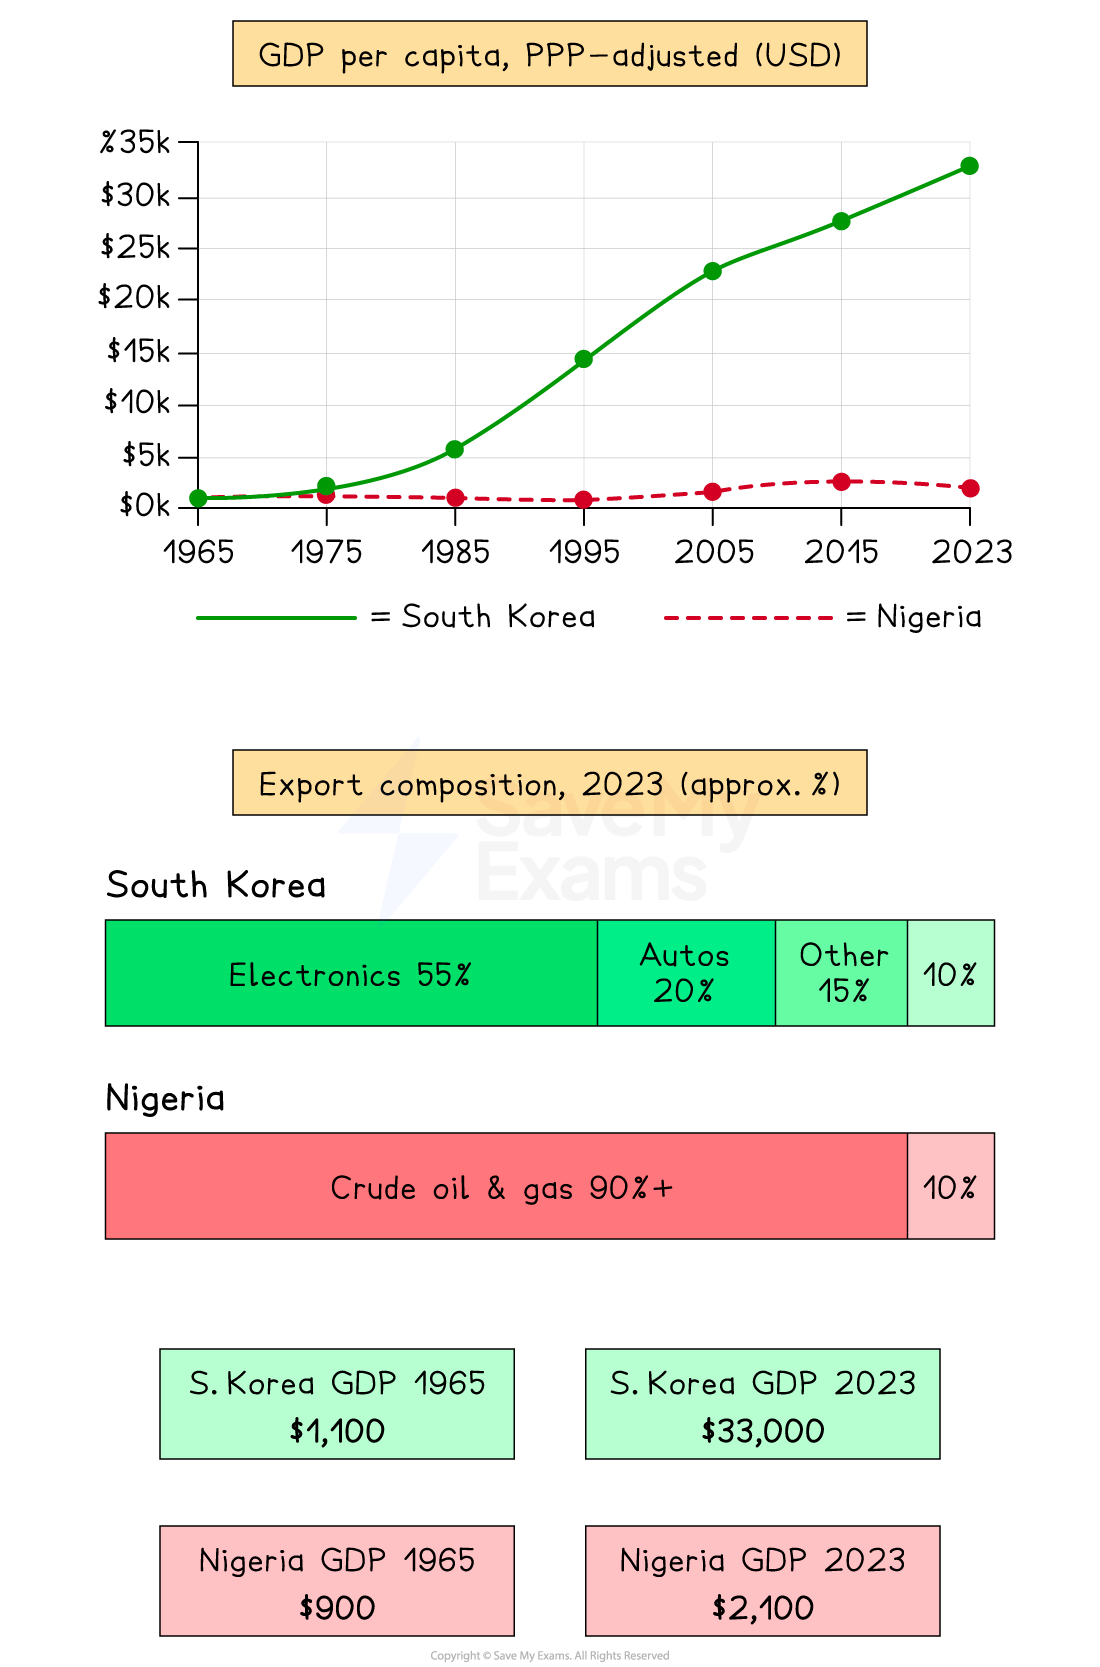
Nigeria's trade pattern remains characteristic of a low-income commodity exporter - high dependence on a single primary export, vulnerability to oil price volatility, and persistent importation of manufactured goods and capital equipment
South Korea's export mix transformed entirely
It now exports high-value manufactures and technology products, with Samsung and Hyundai among the world's leading exporters in their sectors
South Korea's GDP per capita reached over $33,000 by 2023; Nigeria's remained below $2,100
This illustrates how trade pattern and development level reinforce each other over time
Examiner Tips and Tricks
The structural transformation from primary to secondary to tertiary employment is one of the most frequently tested development concepts - always link sector shifts to rising productivity, urbanisation and changing comparative advantage rather than describing them as automatic.
For trade pattern questions, the strongest evaluation point is that the pattern of trade reflects but also reinforces development levels:
commodity dependence traps low-income economies in a low-value-added export structure
while export-led industrialisation requires deliberate policy to shift up the value chain.

Unlock more, it's free!
Join the 100,000+ Students that ❤️ Save My Exams
the (exam) results speak for themselves:

Was this revision note helpful?
