Fiscal Policy & the Laffer Curve (Cambridge (CIE) A Level Economics): Revision Note
Exam code: 9708

Fiscal policy recap
Fiscal policy is the use of government spending and taxation to influence the level and composition of aggregate demand and to achieve macroeconomic objectives
At A Level, evaluation focuses on its effectiveness across multiple objectives simultaneously and the relationship between tax rates and revenue described by the Laffer curve
Recap from AS
The AS syllabus (4.5) covers the main fiscal policy tools and their basic effects
Expansionary fiscal policy - higher government spending and/or lower taxation, raising AD
Contractionary fiscal policy - lower government spending and/or higher taxation, reducing AD
The government budget - deficit when spending exceeds tax revenue, surplus when tax revenue exceeds spending
The multiplier - initial fiscal injections have amplified effects on national income
This content builds on that foundation and adds effectiveness analysis across multiple objectives and Laffer curve analysis
Effectiveness across macroeconomic objectives
Fiscal policy is rarely effective at achieving all macroeconomic objectives simultaneously - it works through different mechanisms for each, with conflicts and side effects
Objective | Mechanism | Effectiveness |
|---|---|---|
Economic growth |
|
|
Low unemployment |
|
|
Low inflation |
|
|
Balance of payments stability |
|
|
Equitable income distribution |
|
|
Examiner Tips and Tricks
Policies that achieve one objective often work against another. Expansionary fiscal policy boosts growth and employment but risks inflation and BoP deterioration. Contractionary fiscal policy reduces inflation but raises unemployment
The Laffer curve
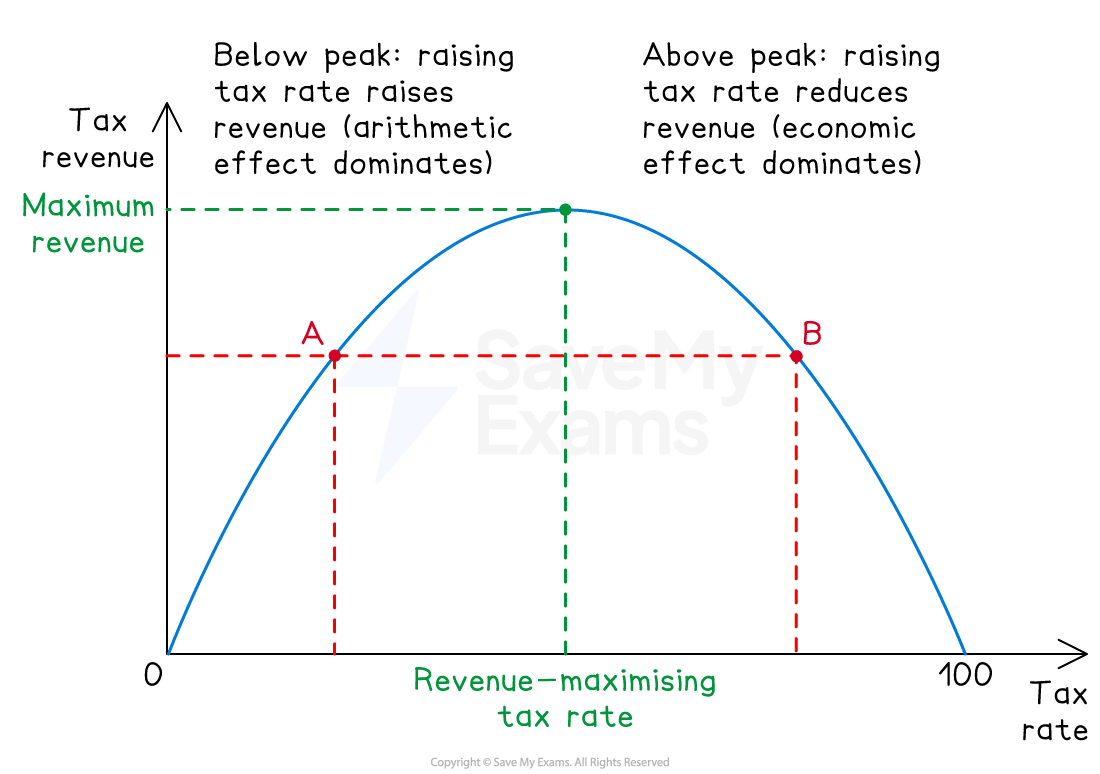
The Laffer curve, popularised by economist Arthur Laffer in 1974, illustrates the relationship between the tax rate and total tax revenue
It shows that tax revenue is zero at both 0% and 100% tax rates, with a revenue-maximising rate somewhere between
The logic
At a 0% tax rate, the government collects no revenue, no matter how large the tax base
At a 100% tax rate, the government also collects no revenue — no one would work, save or invest if all income were taken in tax
Between these extremes, there exists a revenue-maximising tax rate at which government revenue peaks
Above this rate, further tax rate increases reduce total revenue because the disincentive effect on work, investment and tax compliance outweighs the higher rate applied to a shrinking tax base
Two effects of changing tax rates
The Laffer curve combines two opposing effects of tax rate changes
The arithmetic effect - at a higher tax rate, each pound of taxable income generates more revenue (revenue rises mechanically with the rate)
The economic effect - at a higher tax rate, work, investment and reported income fall (the tax base shrinks)
Below the revenue-maximising rate, the arithmetic effect dominates - raising rates raises revenue
Above the revenue-maximising rate, the economic effect dominates - raising rates reduces revenue
Policy implications
If a country is operating above the revenue-maximising rate, cutting tax rates will increase revenue
If a country is operating below the revenue-maximising rate, cutting tax rates will decrease revenue
The location of the peak is empirically uncertain - estimates of the revenue-maximising income tax rate range widely (often cited around 70%, but disputed)
The Laffer curve is therefore conceptually important but empirically contested as a guide to policy
Strengths and limitations
Strengths | Limitations |
|---|---|
|
|
|
|
|
|
|
|
|
|
Worked Example
In 2022, many countries experienced a high rate of inflation caused by disruptions to the supply of goods and services. In one country, the government cut taxes and the central bank raised interest rates.
Evaluate the likely impact of these policies on that government's ability to control inflation.
[20 marks]
Indicative answer structure
AO1 Knowledge: Define inflation, fiscal policy, monetary policy; identify tax cuts as expansionary fiscal policy and rate rises as contractionary monetary policy
AO2 Analysis: Tax cuts raise disposable income → higher consumption → higher AD → demand-pull inflation pressure; rate rises reduce borrowing and consumption → lower AD → reduced inflation pressure. The two policies work against each other — fiscal policy is expansionary while monetary policy is contractionary
AO3 Evaluation: Effectiveness depends on the type of inflation. The question describes supply-side disruption (cost-push inflation) — contractionary monetary policy may raise unemployment without addressing the supply-side cause. Tax cuts may help by reducing cost pressures (e.g. fuel duty cuts) but could worsen demand-pull inflation if poorly targeted. The policy combination is internally contradictory unless tax cuts are tightly targeted at supply-side relief. Conclude that the government's ability to control inflation is undermined by the policy mix unless coordination is strong; supply-side policy is the more theoretically appropriate response to cost-push inflation
Examiner Tips and Tricks
The highest-value framing for fiscal policy questions is to trace the policy through to multiple macroeconomic objectives, not just one. Strong answers show that expansionary fiscal policy that raises growth simultaneously risks higher inflation, worse BoP, and rising debt — and weigh these effects against each other. Treating fiscal policy as a single-objective tool misses the evaluation marks the A Level rewards.
For Laffer curve questions, the key analytical insight are the two effects (arithmetic and economic). Strong answers explain how the relative size of these effects changes along the curve - the arithmetic effect dominates below the peak, the economic effect dominates above it. Mark schemes reward answers that connect the Laffer curve to policy advice - that revenue can sometimes rise from cutting tax rates, but only if the country is operating above the revenue-maximising rate.

Unlock more, it's free!
Join the 100,000+ Students that ❤️ Save My Exams
the (exam) results speak for themselves:

Was this revision note helpful?
