Specialisation & Trade Liberalisation (Cambridge (CIE) A Level Economics): Revision Note
Exam code: 9708

What is specialisation?
Specialisation is the process by which countries focus their productive resources on the goods and services in which they have a comparative advantage, trading surplus output with other nations
When countries specialise in goods where they have a comparative advantage, total world output increases
Specialisation allows countries to exploit economies of scale - concentrating production lowers average costs as output rises
Specialisation drives dynamic efficiency - competition in world markets incentivises firms to innovate and improve productivity
Countries gain access to a wider variety of goods than they could produce domestically, increasing consumer choice and welfare
Free trade (trade liberalisation)
Trade liberalisation is the removal of barriers to international trade - such as tariffs, quotas and subsidies - allowing goods and services to flow freely between countries at world prices
International trade refers to the exchange of goods and services between countries
Exports are goods and services sold to overseas buyers - goods leave the country and money flows in
Imports occur when foreign goods and services are bought by domestic households and firms - money leaves the country and goods enter
International trade is 'free' when there is no government intervention (quotas, taxes etc.) to reduce or limit trade
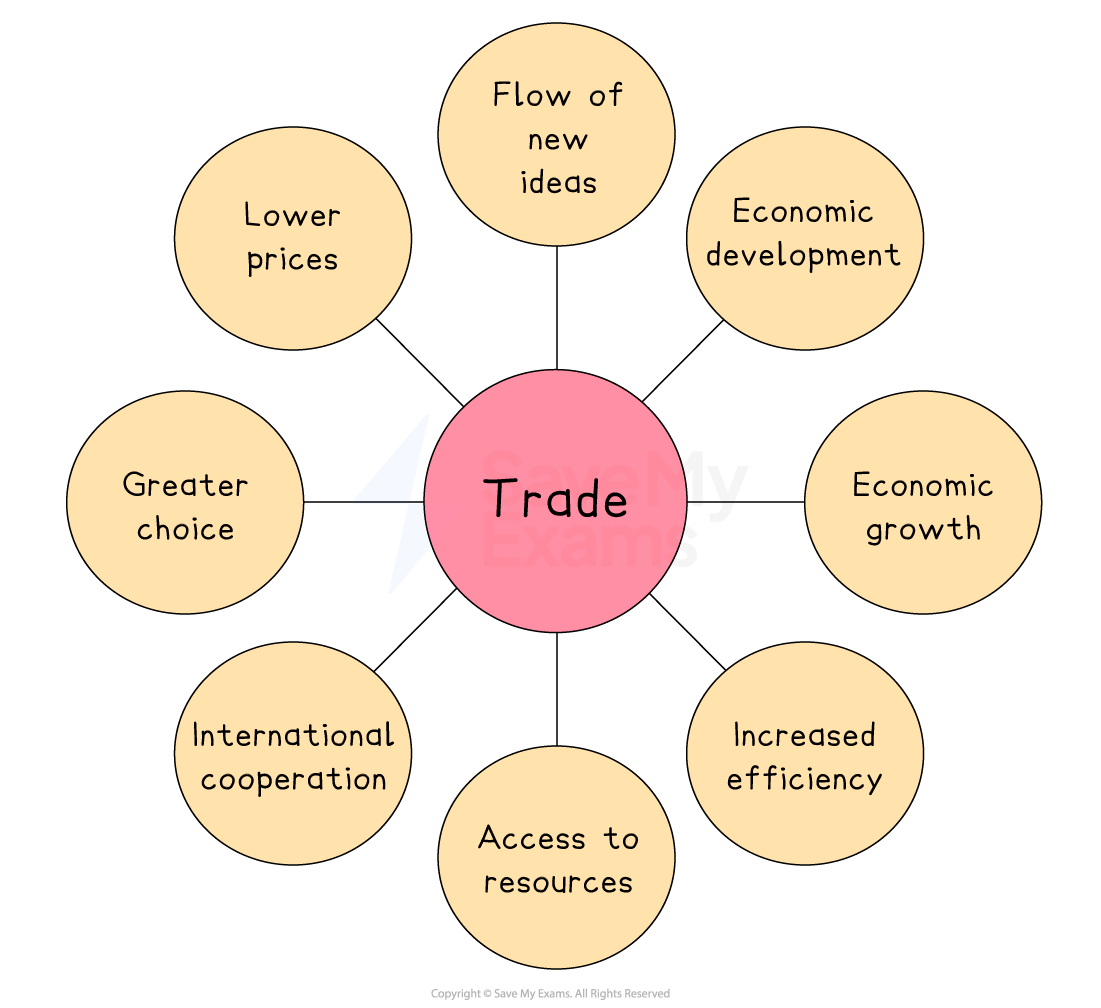
Greater choice: with access to a wider variety of goods and services, the standard of living improves
Lower prices: with international competition prices fall, giving households the ability to buy more
International cooperation: required for trade helps countries to build better relationships which leads to lower levels of hostility
Flow of new ideas: innovative ideas and technology can be shared between countries
Access to resources: output can increase and costs of production can fall with increased access to raw materials
Increased efficiency: international competition allows the most efficient firms to emerge and this improves the use of global resources
Economic growth: exports are a key component of the gross domestic product of many countries and an increase in exports can lead to economic growth
Economic development: Increased output leads to lower levels of unemployment, which leads to higher incomes and a higher standard of living
The trading possibility curve
The trading possibility curve shows the combinations of two goods a country can consume after specialising and trading - consumption possibilities that lie beyond its own PPF
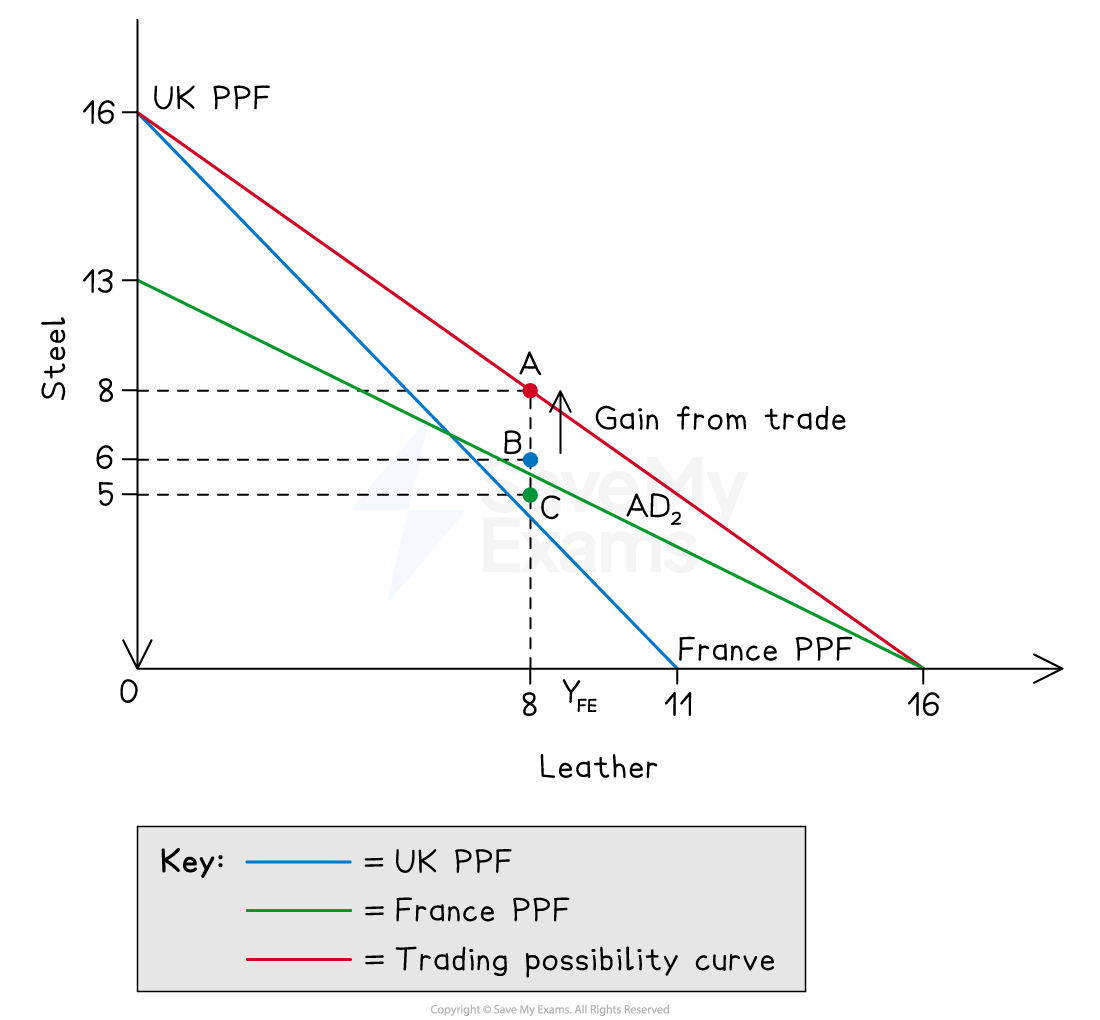
Diagram analysis
Without trade, the UK produces and consumes on its own PPF
It could choose point C (5 steel, 8 leather)
Without trade, France produces and consumes on its own PPF
It could choose point C (6 steel, 8 leather)
The trading possibility curve (red line) runs from (0 steel, 16 leather) to (16 steel, 0 leather), lying beyond both national PPFs
The UK has a comparative advantage in steel (steeper PPF); France has a comparative advantage in leather (flatter PPF)
If both countries specialise completely, the UK produces 16 steel and zero leather; France produces 16 leather and zero steel
Combined world output rises to 16 units of steel and 16 units of leather, more than either country could produce alone
Both countries can now consume at point A (8 steel, 8 leather)
A combination neither could reach independently
The UK produces 16 million units of steel and exports 8 million to France; employment shifts towards steel production
France produces 16 million units of leather and exports 8 million to the UK; employment shifts towards leather production
The gain from trade is the movement from B and C up to point A
Higher consumption of both goods for both countries
Examiner Tips and Tricks
The trading possibility curve is distinct from a PPF - the PPF shows what a country can produce alone; the trading possibility curve shows what it can consume after trade. Always make this distinction explicit and label your diagram clearly with both curves.
When asked to explain the gains from trade using a diagram, identify three things: the pre-trade consumption points on each country's PPF, the trading possibility curve lying beyond both PPFs, and the post-trade consumption point that both countries can now reach. A common error is to draw only one PPF and miss the key comparison entirely.
The trading possibility curve assumes complete specialisation - in practice countries rarely specialise fully. If asked to evaluate the benefits of free trade, this is a strong limitation to develop: adjustment costs, structural unemployment as industries contract, and vulnerability to supply shocks all arise from over-specialisation.

Unlock more, it's free!
Join the 100,000+ Students that ❤️ Save My Exams
the (exam) results speak for themselves:

Was this revision note helpful?
