The Phillips Curve (Cambridge (CIE) A Level Economics): Revision Note
Exam code: 9708

The Phillips curve and the inflation-unemployment relationship
The Phillips curve describes the observed relationship between unemployment and inflation
The traditional version showed a stable inverse trade-off
The expectations-augmented version, developed after the 1970s, distinguishes a short-run trade-off from a vertical long-run curve at the natural rate of unemployment (NAIRU)
The traditional Phillips curve
The traditional Phillips curve, based on A.W. Phillips's 1958 study of UK data from 1861 to 1957, describes a stable inverse relationship between the rate of unemployment and the rate of wage inflation, later extended to price inflation
How does it work?
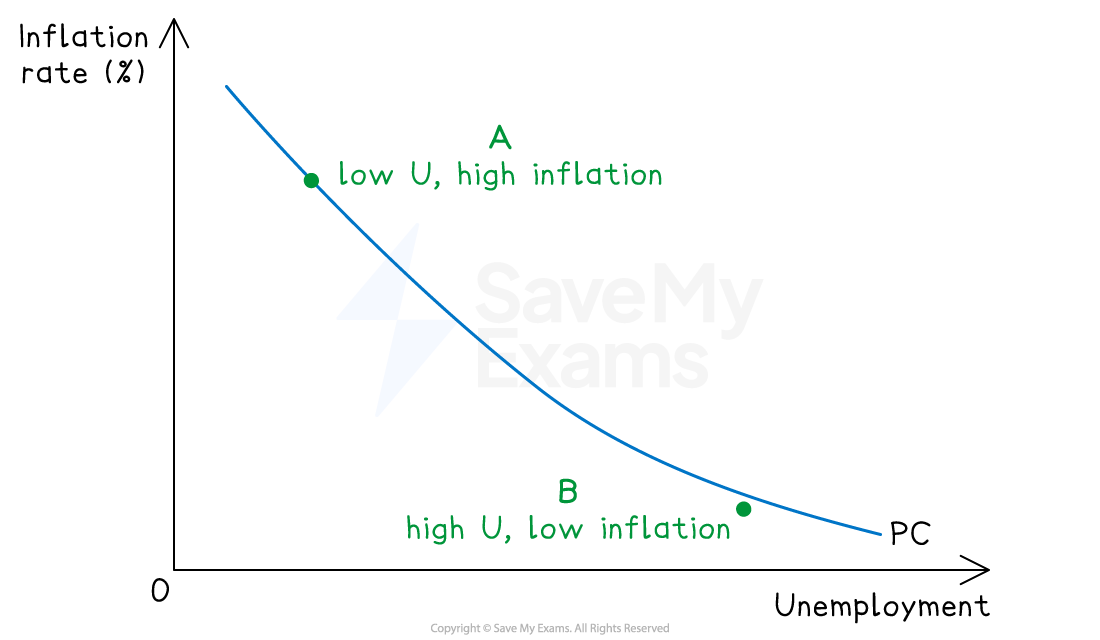
When unemployment is low, labour markets are tight - employers compete for scarce workers, bidding up wages
Higher wages feed into higher prices as firms pass on cost increases - inflation rises
When unemployment is high, the opposite occurs - workers compete for scarce jobs, wages stagnate, and inflation falls
The result is a downward-sloping curve relating inflation to unemployment
Implications for policy
Policymakers face a stable trade-off between inflation and unemployment
Choosing a point on the curve becomes a political decision — accept higher inflation to reduce unemployment, or accept higher unemployment to reduce inflation
The 1960s consensus (Samuelson and Solow, 1960) treated this trade-off as exploitable through monetary and fiscal policy
Why the traditional Phillips curve broke down
The 1970s produced stagflation - simultaneously high inflation and high unemployment - which the traditional Phillips curve could not explain
The 1973 oil shock raised production costs sharply, pushing inflation up
At the same time, the recession that followed pushed unemployment up
Both variables rose together, contradicting the stable inverse relationship the original curve predicted
This empirical failure prompted the development of the expectations-augmented Phillips curve
The expectations-augmented Phillips curve
The expectations-augmented Phillips curve, developed by Milton Friedman (1968) and Edmund Phelps (1967), modifies the traditional model by incorporating inflationary expectations
It distinguishes a short-run trade-off from a vertical long-run curve at the natural rate of unemployment
The short-run Phillips curve (SRPC)
For any given level of inflationary expectations, there is a downward-sloping short-run Phillips curve - the standard inverse trade-off
Workers and firms set wages and prices based on expected inflation
If actual inflation differs from expected, real wages and unemployment are temporarily affected
A rise in actual inflation that exceeds expectations reduces real wages, prompting firms to hire more workers - unemployment falls below the natural rate
This explains why the SRPC slopes downwards in the short run
The long-run Phillips curve (LRPC)
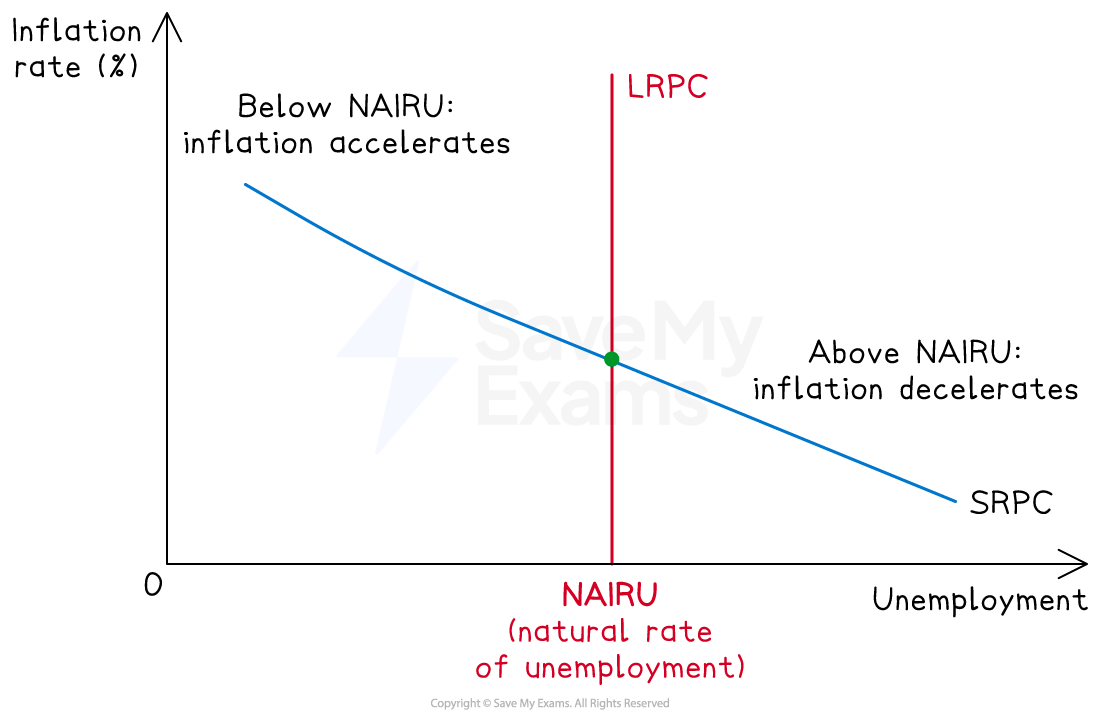
The long-run Phillips curve is vertical at the natural rate of unemployment (NAIRU) - the rate at which inflation neither accelerates nor decelerates
Over time, workers and firms adjust their expectations to actual inflation
Once expectations have fully adjusted, the temporary effect on real wages disappears - unemployment returns to its natural rate
This means there is no long-run trade-off between inflation and unemployment - only the short-run one
The LRPC is therefore vertical at the NAIRU, regardless of the inflation rate
How attempts to exploit the trade-off fail
The expectations-augmented theory predicts that any attempt by policymakers to push unemployment below the NAIRU through expansionary policy will fail in the long run
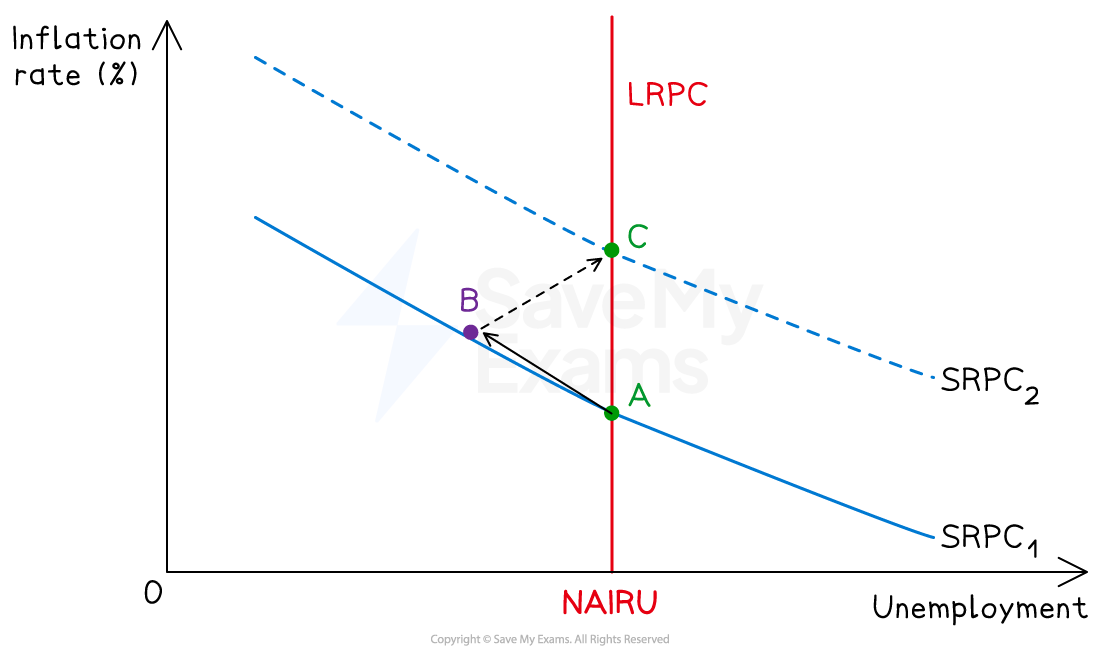
Initially, expansionary monetary policy raises AD, and inflation rises, real wages fall, unemployment falls below NAIRU
The economy moves up the SRPC from point A to point B
Workers observe the higher inflation and revise their expectations upwards
The SRPC shifts upwards as inflation expectations rise
Real wages return to their original level, firms reduce hiring, and unemployment returns to the NAIRU - but at a higher rate of inflation (point C)
Any further attempt to reduce unemployment below NAIRU repeats this process - the SRPC shifts up again, locking in higher inflation without lasting employment gains
The natural rate of unemployment (NAIRU)
NAIRU stands for the Non-Accelerating Inflation Rate of Unemployment
This is the level of unemployment consistent with stable inflation
Below NAIRU, inflation accelerates as expectations rise
Above NAIRU, inflation decelerates as expectations fall
The NAIRU is determined by structural factors such as labour market flexibility, skills mismatch, frictional unemployment, regulation
Reducing the NAIRU itself requires supply-side policies (training, deregulation, improved job matching) rather than demand-side stimulus
Comparing the two theories
Feature | Traditional Phillips curve | Expectations-augmented Phillips curve |
|---|---|---|
Shape |
|
|
Trade-off in long run |
|
|
Role of expectations |
|
|
Implication for monetary policy |
|
|
How to reduce unemployment permanently |
|
|
Explained by 1970s stagflation? |
|
|
Why the disagreement matters for policy
Under the traditional view, monetary policy is a powerful tool, as central banks can fine-tune the inflation-unemployment mix
Under the expectations-augmented view, monetary policy can only manage inflation expectations in the long run; unemployment is determined by supply-side conditions
Modern central banks largely operate under the expectations-augmented framework
They target inflation explicitly (e.g. the Bank of England's 2% target) and treat unemployment as primarily a supply-side issue
Examiner Tips and Tricks
Use the expectations-augmented version as the default, not the traditional one. Strong essay answers introduce the original Phillips curve briefly, explain why it broke down in the 1970s, and then build the analysis around SRPC, LRPC, and NAIRU. Candidates who treat the traditional curve as the main framework miss the modern theoretical understanding.
Diagrams are essential for this topic. Mark schemes expect candidates to draw at least the SRPC and LRPC, with NAIRU labelled and the vertical LRPC at the NAIRU. A more sophisticated diagram showing SRPC shifting upwards as expectations adjust earns higher analysis marks. Show the path A → B → C clearly when discussing how attempts to exploit the trade-off fail.
Use the post-2021 global inflation episode as an evaluative anchor. Central banks raised rates aggressively in 2022–2023 to prevent inflation expectations from un-anchoring - exactly the concern the expectations-augmented framework predicts. The episode shows the framework remains influential in real-world policy, even if the precise NAIRU is uncertain.

Unlock more, it's free!
Join the 100,000+ Students that ❤️ Save My Exams
the (exam) results speak for themselves:

Was this revision note helpful?
