Macroeconomic Equilibrium (Cambridge (CIE) A Level Economics): Revision Note
Exam code: 9708

Short-run macroeconomic equilibrium
Real national output equilibrium occurs where aggregate demand (AD) intersects with short-run aggregate supply (SRAS)
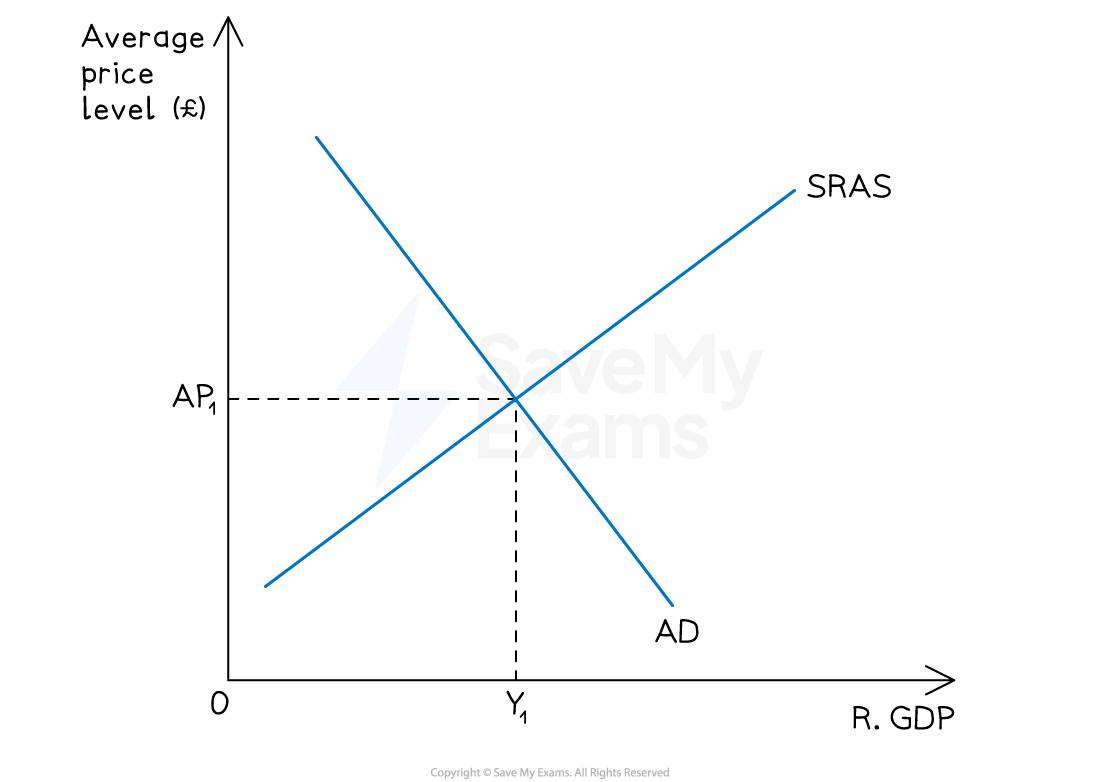
Diagram analysis
This economy is in short run equilibrium at AP1Y1
Any changes to the components of AD will cause the AD curve to shift left or right, creating a new short-run equilibrium
Any changes to the determinants of SRAS will shift the SRAS curve left or right, creating a new short-run equilibrium
The level of employment in the economy is determined by the equilibrium level of output - at Y1, firms require a corresponding level of workers to produce that output
If equilibrium output rises, employment rises; if equilibrium output falls, employment falls
Long-run macroeconomic equilibrium
Free market economists believe that the economy will always return to its normal capacity level of output
In the short-run, there will be fluctuations around this capacity level of output
In the long-run, the economy will return to this normal capacity level of output, but perhaps at a different average price level
It is important to understand the long-run macroeconomic equilibrium as it is used to identify positive and negative output gaps in an economy (this is covered in more detail later on)
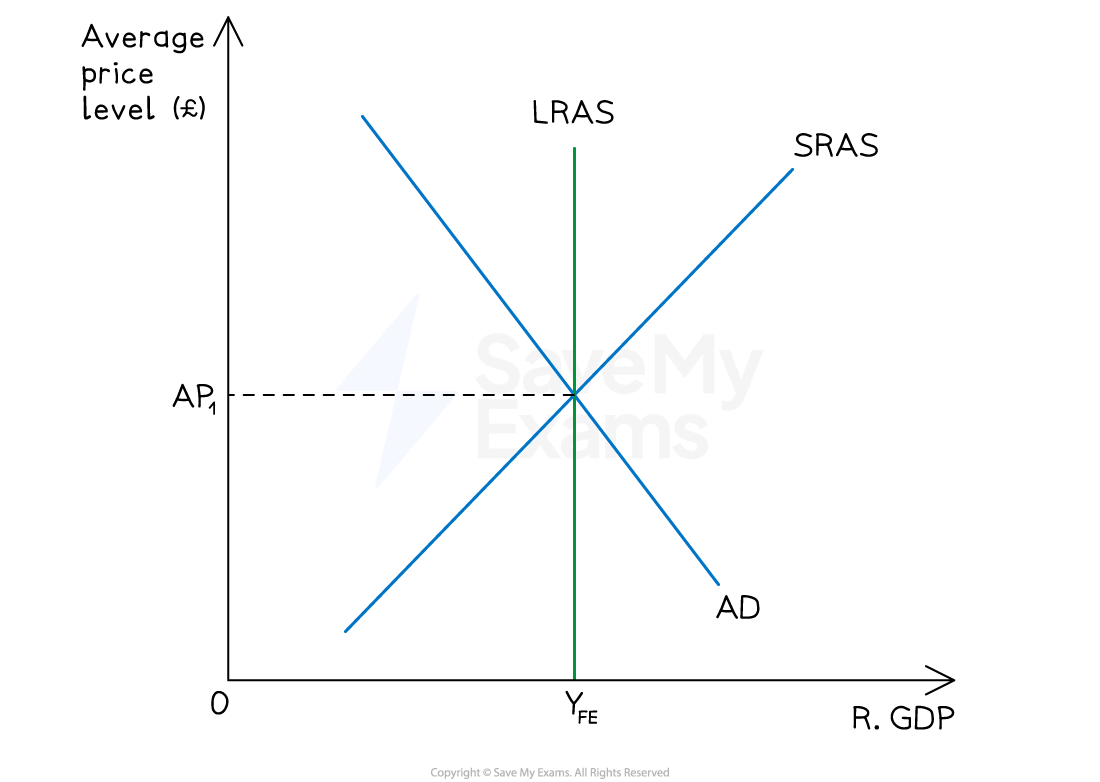
Diagram analysis
The LRAS curve demonstrates the normal capacity level of output of the economy using all of its scarce resources
The SRAS intersects with AD at the LRAS curve
This economy is producing at the full employment level of output (YFE)
The average price level at YFE is AP1
Keynesian long-run equilibrium
The Keynesian view challenges the classical assumption that the economy will always return to full employment output
In the Keynesian model, the economy can settle in long-run equilibrium below full employment - where AD intersects the elastic section of the Keynesian LRAS
At this point, there is significant spare capacity and unemployment in the economy
The price level is stable because spare resources can be brought into production without bidding up factor prices
The economy will not automatically self-correct - without government intervention it may remain at this low output equilibrium indefinitely
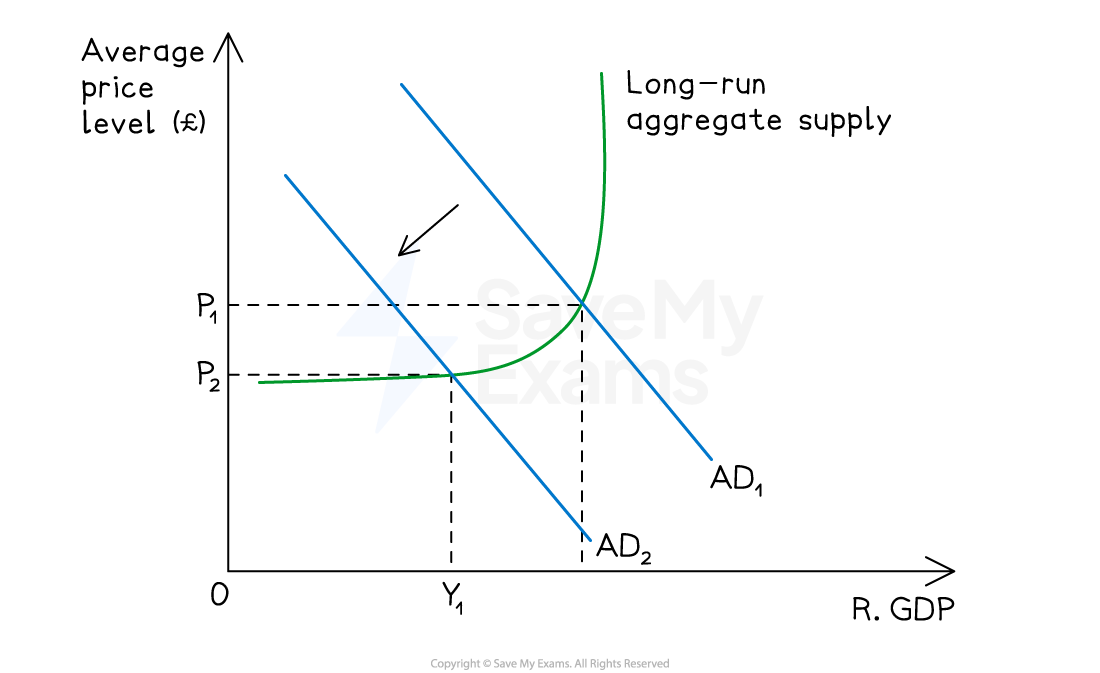
Diagram analysis
The economy is initially in equilibrium at P1YFE - at the full employment level of output on the vertical section of the Keynesian LRAS
A fall in AD causes the AD curve to shift left from AD1 to AD2
The new equilibrium is at P2Y1 - below the full employment level of output YFE
There is now a negative output gap equal to Y1YFE - the economy is producing below its potential
The price level has fallen from P1 to P2 - the economy is on the upward-sloping section of the Keynesian LRAS where both output and price level changes occur
Unlike the classical model, the economy will not automatically return to YFE - wages and prices are sticky downwards and the self-correction mechanism breaks down at low levels of output
This provides the Keynesian justification for government intervention - an increase in AD via expansionary fiscal policy can shift AD2 back rightward, raising output and employment back towards YFE
Aggregate demand and supply analysis
1. An increase in aggregate demand (AD)
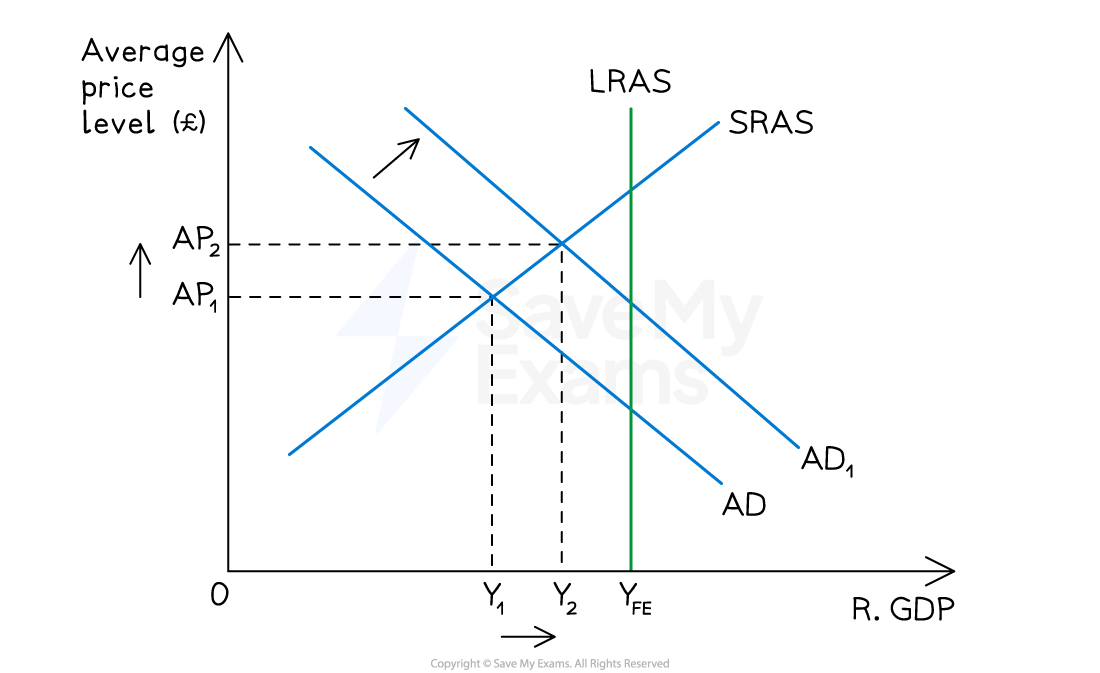
Diagram analysis
The initial equilibrium level of output was at AP1Y1
An increase in one of the components of AD (e.g. consumption) causes the AD to increase AD1→AD2
Average prices in the economy rise to AP2 and the real level of output increases to Y2
The new short-run equilibrium is at AP2Y2
As output rises from Y1 to Y2, firms require more workers to meet higher demand - employment rises; conversely a fall in AD would reduce output and employment
2. An increase in short run aggregate supply (SRAS)
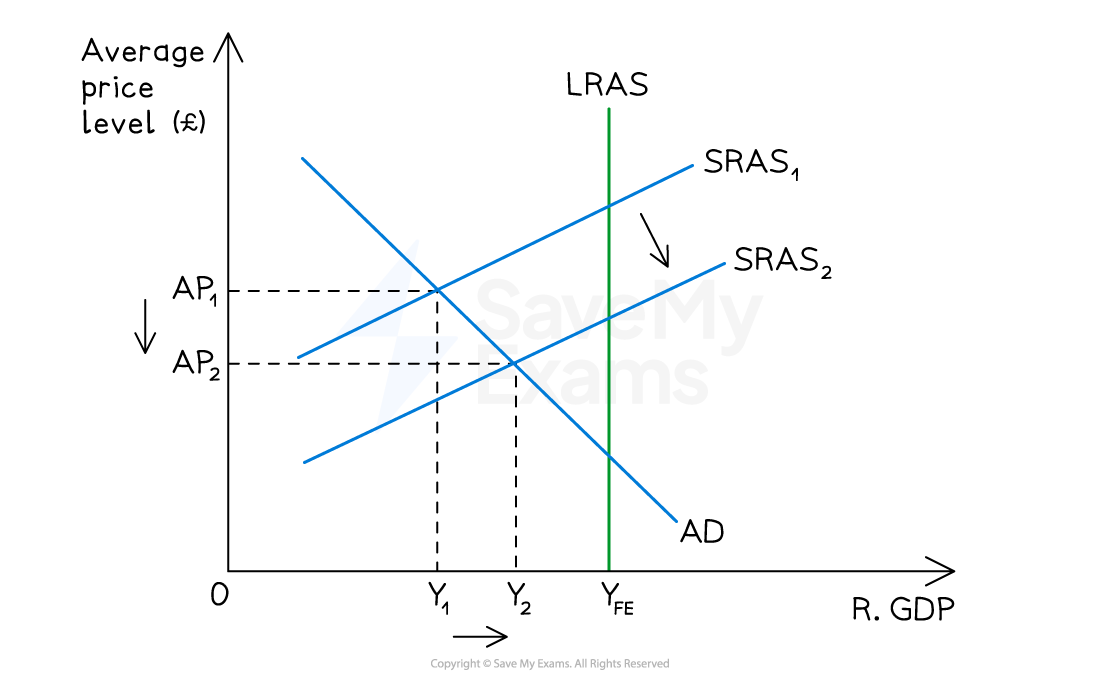
Diagram analysis
The initial equilibrium level of output was at AP1Y1
This equilibrium represents a negative output gap equal to Y1YFE
An increase in one of the determinants of SRAS (e.g. productivity) causes the SRAS to increase SRAS1→SRAS2
Average prices in the economy fall to AP2 and the real level of output increases to Y2
The new short-run equilibrium is at AP2Y2
There is still a negative output gap but it is smaller (Y2YFE)
As output rises from Y1 to Y2, more workers are needed in production - employment rises and the negative output gap narrows, meaning unemployment falls though it does not return to zero until YFE is reached
Worked Example
A government has increased output with no effect on the price level.

What must have been the initial level of aggregate demand?
A. AD1 B. AD2 C. AD3 D. AD4
Answer: A - AD1
Worked solution
This question tests understanding of the Keynesian LRAS and which section of the curve the economy is operating on.
The key condition in the question is that output increased with no effect on the price level. This can only occur on the highly elastic (flat) section of the Keynesian LRAS - where there is significant spare capacity and unemployment, so firms can increase output by drawing on idle resources without bidding up factor prices.
If AD shifts right from a position on the elastic section, real output rises, but the price level remains unchanged
If the economy were already on the upward-sloping or vertical section, any rightward shift in AD would raise the price level
Examiner Tips and Tricks
Always state the effect on all three variables when analysing an AD or AS shift - real output, the price level, and employment.
A common error is to identify the new equilibrium price and output but forget employment entirely. Remember that employment moves in the same direction as real output - rising output means firms need more workers; falling output means fewer workers are needed.
For the Keynesian model, always identify which section of the LRAS the economy is operating on before analysing the effect of an AD shift. A rightward shift in AD on the elastic section raises output without raising prices and increases employment - the same shift on the vertical section is purely inflationary with no output or employment effect.

Unlock more, it's free!
Join the 100,000+ Students that ❤️ Save My Exams
the (exam) results speak for themselves:

Was this revision note helpful?
