Taxation (Cambridge (CIE) A Level Economics): Revision Note
Exam code: 9708

Types of taxes
The main source of government revenue is taxation
Direct taxes are taxes imposed on income and profits
They are paid directly to the government by the individual or firm
E.g., income tax, corporation tax, capital gains tax, national insurance contributions and inheritance tax
Indirect taxes are imposed on spending
The less a consumer spends, the less indirect tax they pay
Examples of indirect tax include Value Added Tax (19% VAT rate in the European Union in 2022), taxes on demerit goods and excise duties on fuel
Progressive, regressive and proportional tax systems
Tax systems can be classified as progressive, regressive or proportional
Most countries have a mix of progressive (direct taxation) and regressive (indirect taxation) taxes in place
Progressive tax system

As income rises, a larger percentage of income is paid in tax
In the diagram, when personal income rises from Y1 to Y2, the tax rate rises from T1 to T2
Regressive tax system

Indirect taxes are regressive in terms of proportion of income
A high earner and a low earner pay the same absolute amount of VAT on a good, but it represents a larger share of the low earner's income.
As income rises, a smaller percentage of income is paid in tax
In the diagram, when personal income rises from Y1 to Y2, the tax rate falls from T1 to T2
All indirect taxes are regressive
In the USA, Federal income tax is progressive but almost all State taxes are regressive (the bottom 20% of income earners pay as much as 6x the % of their income than the top 20%)
Proportional tax system

As income rises, the same percentage of income is paid in tax
In the diagram, when personal income rises from Y1 to Y2, the tax rate remains constant at 20%
In 2022, Bolivia was using this system with a proportional tax rate of 13%
Examiner Tips and Tricks
Never confuse direct and indirect taxes with progressive and regressive - these are separate classifications. Income tax is both direct and progressive. VAT is both indirect and regressive.
A tax can be direct and proportional (like Bolivia's flat income tax) or indirect and regressive (like fuel duty). Always state both classifications when describing a tax.
For marginal and average rate calculations, always work through the tax bands in order and calculate each band separately before summing. The most common error is applying the highest marginal rate to total income rather than only to the income within that band. The average rate will always be lower than the highest marginal rate in a progressive system.
Marginal and average rates of taxation (mrt, art)
Marginal rate of tax (MRT) is the proportion of each additional dollar of income taken in tax - the rate paid on the last unit of income earned
In a progressive tax system, marginal tax rates increase as income increases
Average rate of tax (ART) is the proportion of total income taken in tax - total tax paid divided by total income
Direct tax rate calculations usually focus on the calculation of marginal and average tax rates from a set of data provided
Average tax rates are calculated using the following formula
Worked Example
Using information from the table below, calculate the average tax rate paid by an employee who earns $25,000 a year.
[4 marks]
Income ($ per year) | Rate of Income Tax |
1 - 10,000 | 5% |
10,001 - 18,000 | 10% |
18,001 - 35,000 | 20% |
35,001 and over | 30% |
Answer:
Step 1: Calculate the tax paid on the first $10,000
5% x 10,000 = $500
Step 2: Calculate the tax paid on income between $10,001 - $18,000
10% x $7,999 = $799.90
Step 3: Calculate the tax paid on income between $18,001 and $25,000 (the employees income)
20% x 6,999 = $1,399.80 [1 mark]
Step 4: Add the marginal tax paid together to obtain the total tax bill for the employee
$500 + $799.90 + $1,399.80 = $2,699.70 [1 mark]
Step 5: Calculate the average rate of tax for the employee
[1 mark]
Step 6: Present your answer rounded to two decimal places
Average tax rate = 10.80% [1 mark]
Reasons for taxation
Nearly every economy in the world is a mixed economy and has varying degrees of government intervention
One of the main reasons that governments tax is to correct various market failures

To raise revenue
The primary purpose of most taxes is to fund government expenditure on public goods, merit goods and transfer payments
Without tax revenue, governments could not provide national defence, education, healthcare or social security
To redistribute income and wealth
Progressive taxes take a higher proportion of income from higher earners, reducing inequality and improving equity
Income tax and inheritance tax are used explicitly for this purpose in most economies
To correct market failure
Indirect taxes on demerit goods and goods generating negative externalities aim to internalise external costs and reduce consumption towards the socially optimal level
Examples include taxes on tobacco, alcohol and carbon emissions
To discourage certain behaviours
Closely related to market failure correction, governments use taxation to reduce consumption of harmful goods where the social cost exceeds the private cost
To manage aggregate demand and achieve macroeconomic objectives
Taxation is a tool of fiscal policy; raising taxes reduces household disposable income and firm profits, contracting aggregate demand during periods of high inflation
Case Study
Reasons for taxation - carbon taxes in Sweden
The context
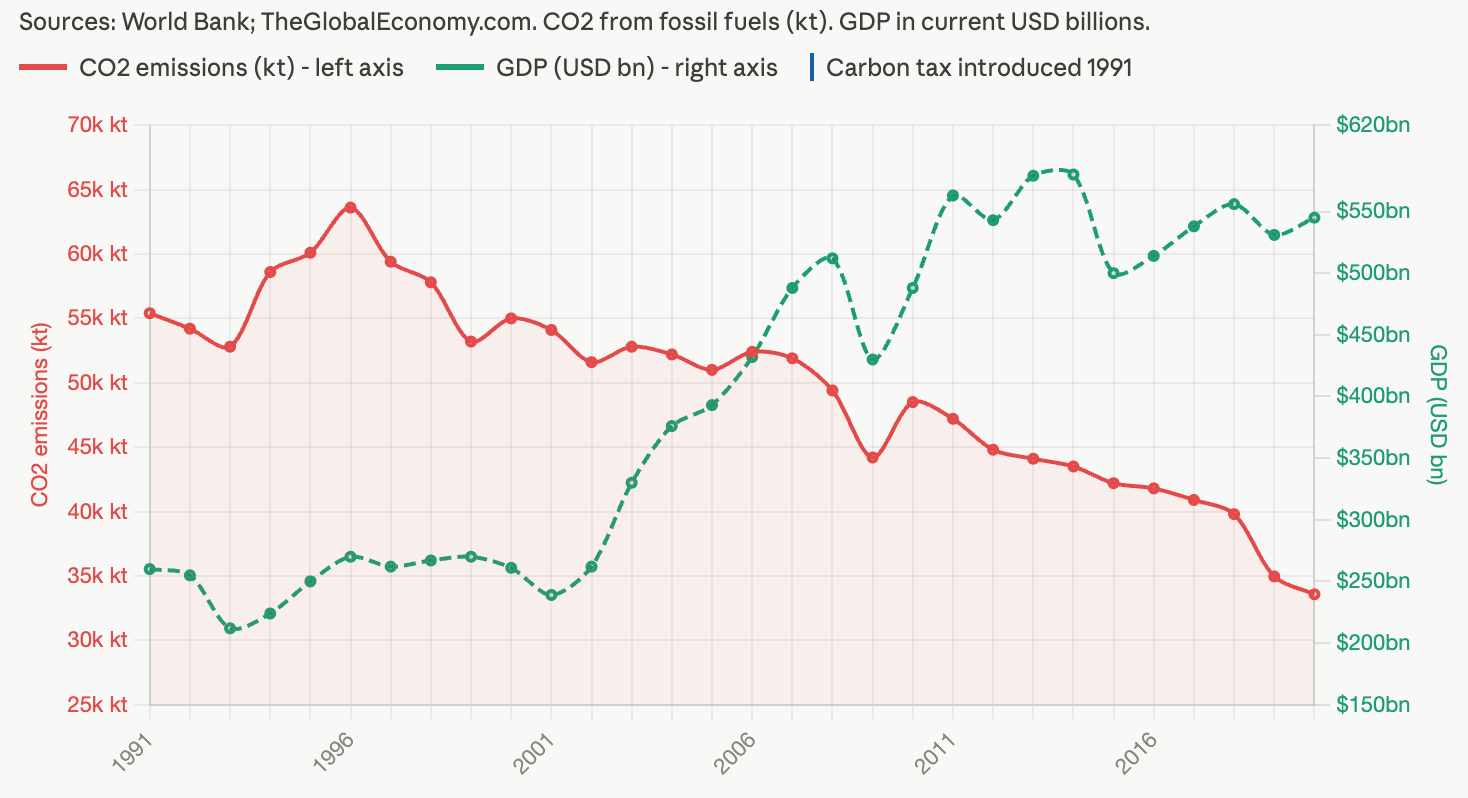
Sweden introduced one of the world's first carbon taxes in 1991, initially set at approximately $30 per tonne of CO₂. By 2023 it had risen to approximately $130 per tonne - the highest carbon tax rate in the world.
Actions taken
The tax raised the private cost of burning fossil fuels, bringing it closer to the social cost by internalising the negative externality of carbon emissions
Revenue was used to reduce income taxes and fund renewable energy investment - simultaneously correcting market failure and redistributing fiscal resources
Outcomes
Sweden's carbon emissions fell by approximately 27% between 1991 and 2020, while real GDP grew by over 75% - demonstrating that environmental taxation need not harm growth
The tax illustrates three reasons for taxation simultaneously - correcting market failure, raising revenue for public investment, and managing aggregate demand
However the tax is regressive in impact - lower-income households spend a higher proportion of income on heating and transport, bearing a disproportionate burden - illustrating the equity-efficiency trade-off in environmental taxation

Unlock more, it's free!
Join the 100,000+ Students that ❤️ Save My Exams
the (exam) results speak for themselves:

Was this revision note helpful?
