Single Economic Indicators (Cambridge (CIE) A Level Economics): Revision Note
Exam code: 9708

Introducing single economic indicators
Single economic indicators measure one dimension of living standards or development using a single metric
They are straightforward to calculate and compare but cannot capture the full complexity of human welfare
They are divided into:
monetary indicators, which express living standards in income or output terms
non-monetary indicators, which measure specific aspects of welfare such as health and education that income data cannot directly capture
Monetary indicators of development
Monetary indicators are measures of living standards expressed in money terms, typically based on national income statistics such as GDP, GNI or NNI per capita
They provide a quantitative, internationally comparable measure of average economic output or income
What each measures
Indicator | Definition | Best used for |
|---|---|---|
Real GDP per capita |
|
|
Real GNI per capita |
|
|
Real NNI per capita |
|
|
GNI per capita is preferred to GDP per capita for international comparisons
It captures remittance inflows and foreign-owned production that GDP misses
Purchasing Power Parity (PPP) is not an indicator but an adjustment method
It converts income figures using exchange rates that equalise purchasing power across countries, correcting for price-level differences
PPP-adjusted GNI per capita is a more accurate measure of real living standards than nominal GNI per capita
Issues of comparison using monetary indicators
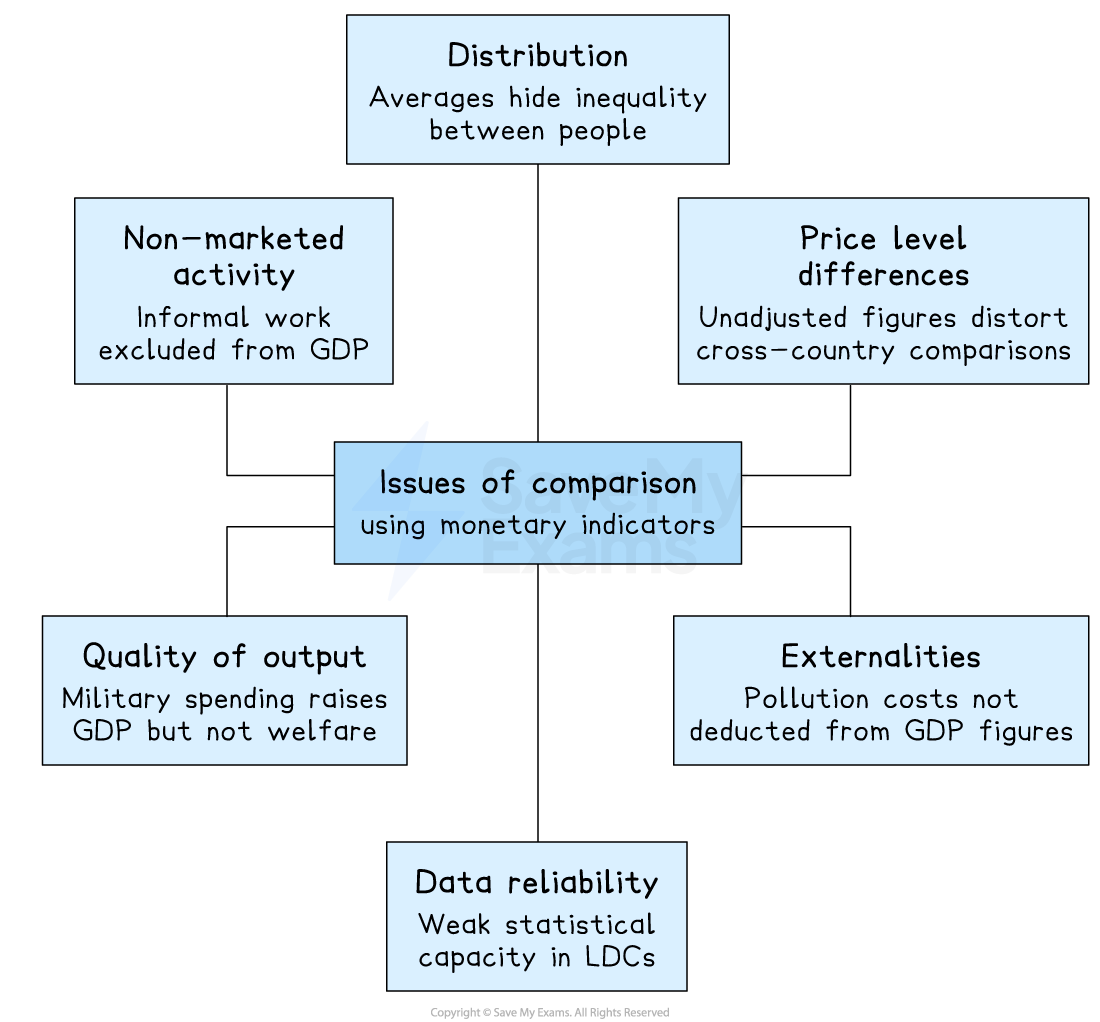
Distribution
Identical GNI per capita can coexist with extreme inequality - the average tells you nothing about the typical person
Non-marketed activity
Subsistence farming and informal work are real output but invisible to GDP, systematically understating living standards in low-income economies
Price level differences
A dollar buys far more in Ethiopia than Germany - only PPP-adjusted figures allow valid cross-country comparisons
Quality of output
A country spending heavily on weapons and prisons will show higher GDP than one spending the same on healthcare and schools
Externalities
GDP counts the output of polluting industries but not the environmental damage they cause, overstating welfare in industrialised economies
Data reliability
Low-income economies often lack the statistical capacity to measure GDP accurately, so the figures that matter most are the least reliable
Worked Example
The table shows what has happened to three economic indicators between two years in a country. When would GDP have been the most accurate measure of the standard of living in that country?
Population | Inflation rate | Income distribution | |
|---|---|---|---|
A | constant | low and stable | equal |
B | constant | low and unstable | unequal |
C | rising | low and stable | equal |
D | rising | low and unstable | unequal |
Answer: A
Population constant - GDP per capita is most meaningful when population is stable; if population is rising, per capita figures may fall even as total output rises, or mask differences between people
Inflation low and stable - when inflation is low and stable, nominal and real GDP move closely together; high or volatile inflation distorts GDP figures and makes comparisons between years unreliable
Income distribution equal - GDP per capita is an average; it only reflects individual living standards accurately when income is evenly distributed across the population. Unequal distribution means the average can rise while many people experience no improvement
Worked solution
Option B fails because unstable inflation makes GDP an unreliable real measure
Option C fails because rising population means per capita GDP may not rise even if total GDP does
Option D fails on all three grounds — rising population, unstable inflation and unequal distribution all undermine GDP as a living standards measure
Examiner Tips and Tricks
The critical distinction is GDP vs GNI
GDP measures output within borders regardless of ownership, while GNI measures income earned by residents regardless of location. In countries with large multinational presences, GDP significantly overstates residents' living standards because profits are repatriated abroad.
Always check whether a figure is adjusted for inflation, population growth and price level differences before drawing conclusions about living standards.
Non-monetary indicators of development
Non-monetary indicators are measures of living standards expressed in non-income terms
They capture dimensions of welfare such as health, education and access to basic services that monetary figures alone cannot reflect
Indicator | What it measures | Key limitation |
|---|---|---|
Life expectancy at birth |
|
|
Infant mortality rate |
|
|
Adult literacy rate |
|
|
Access to clean water and sanitation |
|
|
Mean years of schooling |
|
|
Non-monetary indicators share a common limitation — they are single-dimensional, measuring one aspect of living standards in isolation without capturing the full picture of welfare or developmenthere I go

Unlock more, it's free!
Join the 100,000+ Students that ❤️ Save My Exams
the (exam) results speak for themselves:

Was this revision note helpful?
