Short-Run Costs (Cambridge (CIE) A Level Economics): Revision Note
Exam code: 9708

Types of short-run costs
In the short run, some factors of production such as factory space or machinery are fixed, while others, such as labour or raw materials can be varied
This creates two types of costs:
Fixed costs, which do not change with output
Variable costs, which change as production increases
These together form the short-run cost structure of a firm
Fixed and variable costs
1. Fixed costs (FC)
Fixed costs are expenses that do not change with the level of output. They must be paid even if the firm produces nothing
Examples include rent for premises, insurance premiums, and salaries of permanent staff
A cinema pays rent and licensing fees whether it screens films or not
On a graph, total fixed costs appear as a horizontal line, since they remain constant regardless of output
Firms operating in industries with high fixed costs such as hotels or airlines often aim to maximise output
This helps to spread these costs over more units, thereby reducing the average fixed cost per unit
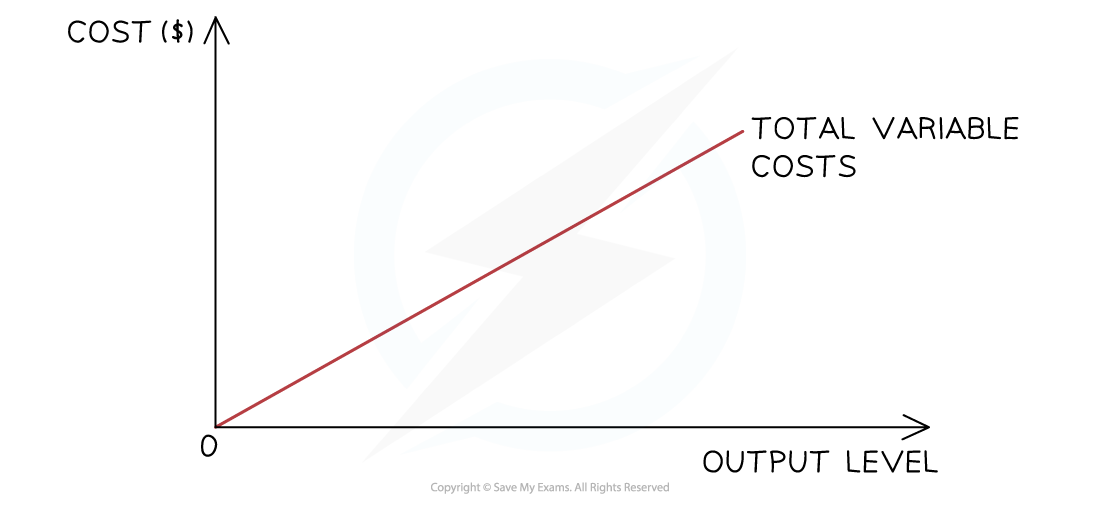
2. Variable costs (VC)
Variable costs change directly with the level of production
These include expenses such as wages for temporary staff, electricity used in production, and the cost of raw materials
For example, a bakery’s flour and sugar costs rise as more cakes are baked.
Variable costs increase with output and are crucial for calculating total cost
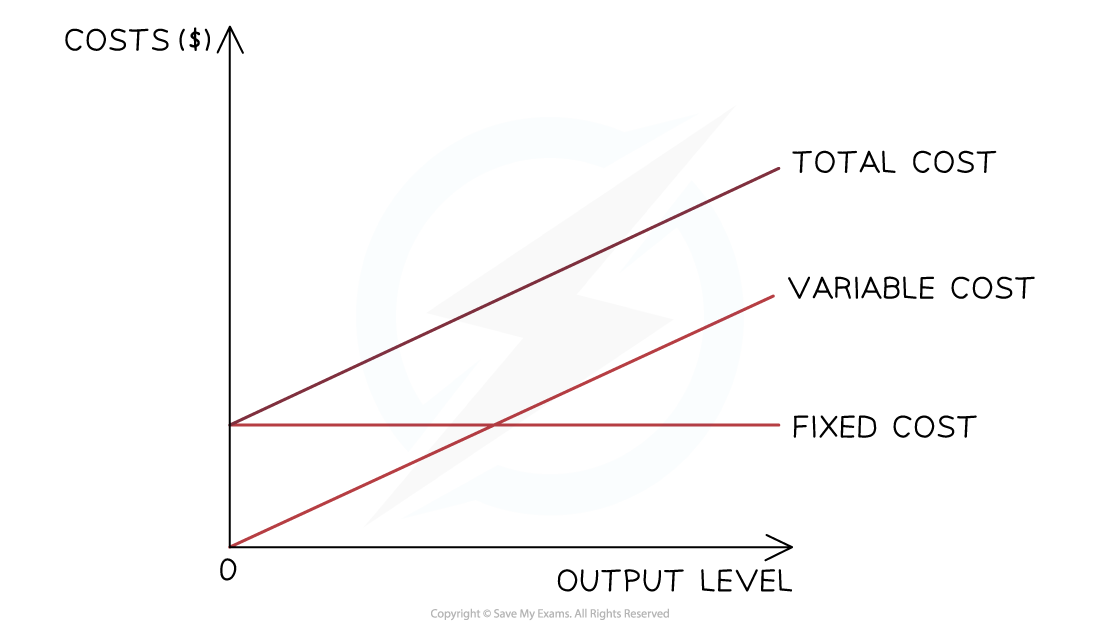
3. Total cost (TC)
Total cost represents the overall cost of producing a given level of output
It is the sum of fixed and variable costs
![]()
Where:
TFC = total fixed costs
TVC = total variable costs
As output increases, total cost rises because variable costs increase
Average costs
Average costs measure the cost per unit of output
1. Average total cost (ATC)
Average total cost shows the total cost of producing each unit of output
![]()
Where:
TC = total cost
Q = quantity of output
2. Average fixed cost (AFC)
Average fixed cost measures the fixed cost per unit of output
![]()
As output increases, average fixed cost falls because the fixed costs are spread across more units
This is sometimes called 'spreading overheads' or 'fixed cost spreading'
3. Average variable cost (AVC)
Average variable cost measures the variable cost per unit of output
![]()
AVC may initially fall due to better use of variable inputs, but eventually rises due to the law of diminishing returns
Marginal cost (MC)
Marginal cost is the increase in total cost caused by producing one more unit of output
![]()
Because fixed costs do not change with output in the short run, marginal cost can also be calculated using:
![]()
Marginal cost typically:
Falls at first, due to increasing productivity
Then rises as diminishing returns occur
This creates the U-shaped marginal cost curve
The MC curve intersects the ATC and AVC curves at their minimum points
Worked Example
Cost calculations using the above formulas
Assume:
Total fixed cost (TFC) = $200
Variable costs rise at an increasing rate as output increases
This reflects the law of diminishing returns, where additional workers become less productive and production becomes more expensive
This means:
Total variable cost (TVC) increases at an increasing rate
Marginal cost (MC) eventually rises
Short-run cost calculations example
Output (Q) | TFC | TVC | TC = | MC =
| AFC = | AVC = | ATC = |
|---|---|---|---|---|---|---|---|
0 | 200 | 0 | 200 | – | – | – | – |
1 | 200 | 50 | 250 | 50 | 200 | 50 | 250 |
2 | 200 | 90 | 290 | 40 | 100 | 45 | 145 |
3 | 200 | 140 | 340 | 50 | 66.67 | 46.67 | 113.33 |
4 | 200 | 200 | 400 | 60 | 50 | 50 | 100 |
5 | 200 | 280 | 480 | 80 | 40 | 56 | 96 |
6 | 200 | 380 | 580 | 100 | 33.33 | 63.33 | 96.67 |
7 | 200 | 520 | 720 | 140 | 28.57 | 74.29 | 102.86 |
8 | 200 | 700 | 900 | 180 | 25 | 87.5 | 112.5 |
What this table demonstrates
TFC remains constant at $200 because fixed costs do not change with output
TVC increases at an increasing rate due to the law of diminishing returns
MC initially falls, then rises as diminishing returns begin
AFC always falls as fixed costs are spread over more output
ATC falls initially, then rises as increasing marginal costs dominate
Drawing and interpreting cost diagrams
Fixed costs (FC)

The firm must pay its fixed costs even if output is zero
Fixed costs do not change with the level of output
Variable costs (VC)
Initially, variable costs may increase slowly as labour becomes more productive
As more variable factors are added to fixed factors, the law of diminishing returns causes variable costs to rise at an increasing rate
Total cost (TC)
The total cost is the sum of the variable and fixed costs
The total costs cannot be 0, as all firms have some level of fixed costs
Average fixed cost (AFC)

If the fixed costs of a firm are $1,000 and it produces 1 unit of output, then its AFC is $1,000 ($1,000/1)
If the firm increases its output to 1000 units, then the AFC is $1 per unit ($1000/1,000)
The more units a firm produces, the lower its AFC will be
This is one reasons why large levels of output help to increase the profit per unit
Average total cost (ATC)

As a firm grows, it is able to increases its scale of output generating efficiencies that lower its average total costs (AC) of production
As a firm continues increasing its scale of output, it will reach a point where its average total costs (AC) start to increase
ATC is U-shaped mainly because of:
increasing returns initially
diminishing returns later
Marginal costs (MC)
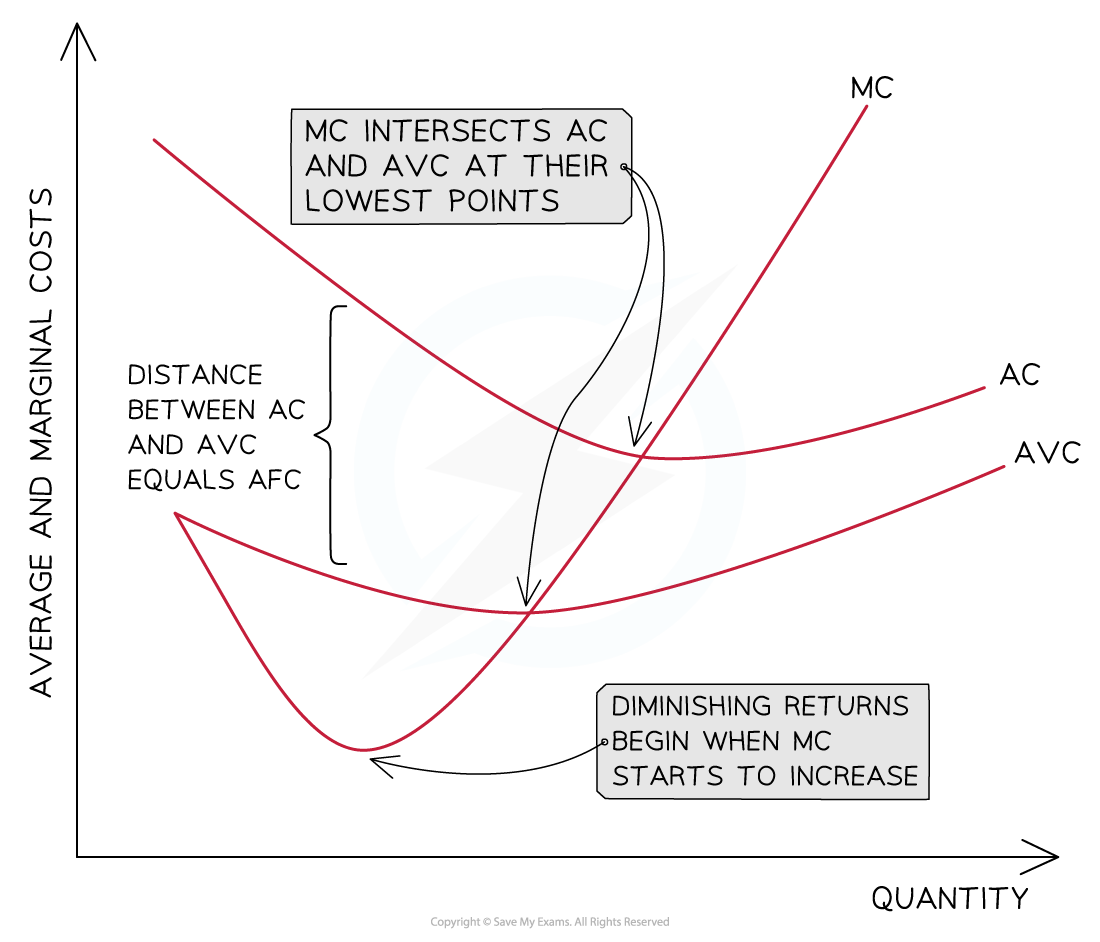
The distance between the AVC and AC = the AFC
AVC converges towards AC as the AFC continuously decreases with an increase in output
AVC decreases as additional workers are added and each worker produces additional product
Marginal costs (MC) decrease initially as additional workers are added and the marginal product is increasing
Diminishing returns begin when the MC starts to increase
MC will cross the AVC and AC curves at their lowest point
As long as the cost of producing the next unit (MC) is lower than the average, it will pull down the average
When the cost of producing the next unit (MC) is higher than the average, it will pull up the average

Unlock more, it's free!
Join the 100,000+ Students that ❤️ Save My Exams
the (exam) results speak for themselves:

Was this revision note helpful?
