Supply Curves (Cambridge (CIE) A Level Economics): Revision Note
Exam code: 9708

An introduction to supply
Supply is the amount of a good or service that a producer is willing and able to supply at a given price in a given time period
A supply curve is a graphical representation of the price and quantity supplied by producers
If the data were plotted, it would be an actual curve. Economists, however, use straight lines so as to make analysis easier
The supply curve is upward sloping, as there is a positive relationship between the price and quantity supplied (QS)
Rational profit maximising producers would want to supply more as prices increase in order to maximise their profits
The law of supply states that there is a positive (direct) relationship between quantity supplied and price, ceteris paribus
When the price rises, the QS rises
When the price falls, the QS falls
Individual and market supply
Market supply is the combination of all the individual supply for a good or service
It is calculated by adding up the individual supply at each price level
The Monthly Market Supply of Bread from 4 Bakeries in a Small town
Bakery 1 | Bakery 2 | Market Supply |
|---|---|---|
500 | 400 | 900 |
Individual and market supply curves
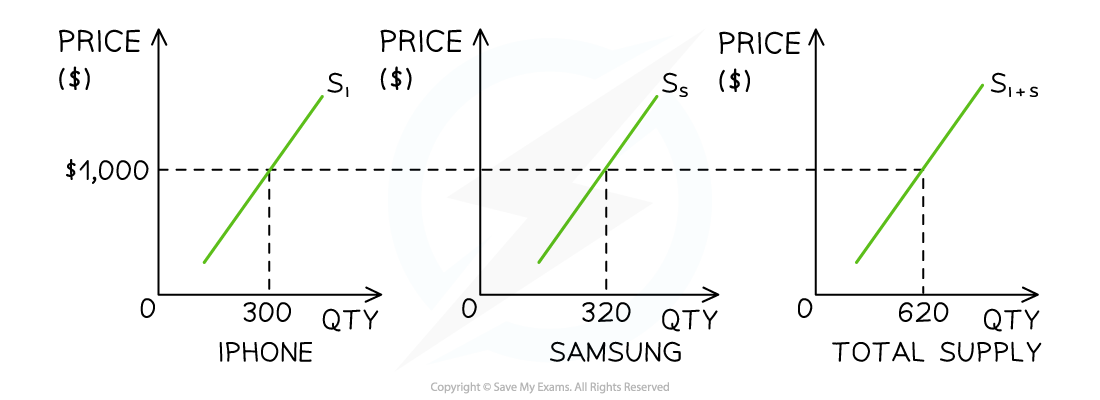
Diagram analysis
In New York City, the market supply for smartphones in December is predominantly a combination of iPhone and Samsung supply
At a price of $1000, the supply of iPhones is 300 units and the supply of Samsung phones is 320 units
At a price of $1,000, the market supply of smartphones in New York City during December is 620 units
Movements along the supply curve
If price is the only factor that changes (ceteris paribus), there will be a change in the quantity supplied (QS)
This change is shown by a movement along the supply curve
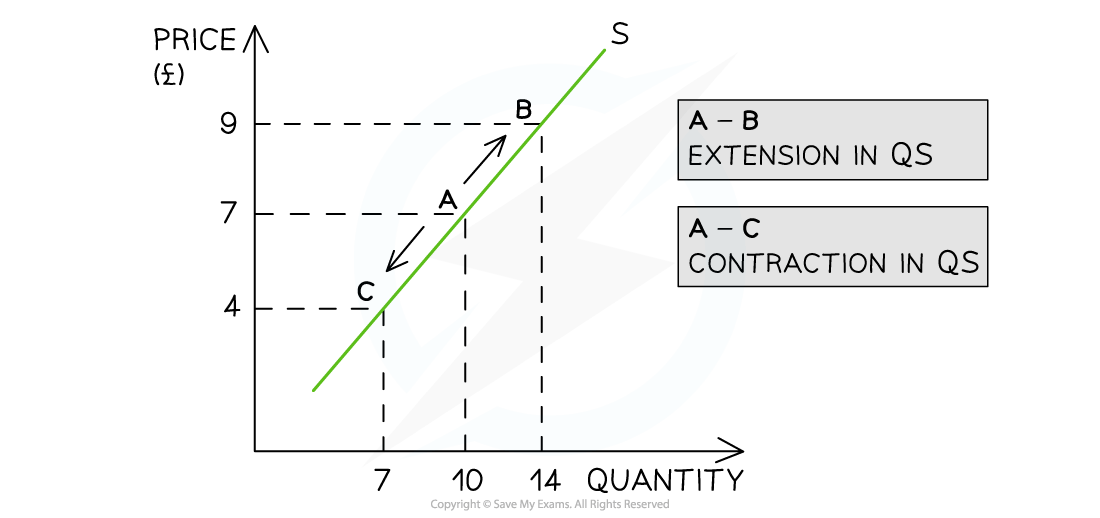
Diagram analysis
An increase in price from £7 to £9 leads to a movement up the supply curve from point A to B
Due to the increase in price, the quantity supplied has increased from 10 to 14 units
This movement is called an extension in QS
A decrease in price from £7 to £4 leads to a movement down the supply curve from point A to C
Due to the decrease in price, the quantity supplied has decreased from 10 to 7 units
This movement is called a contraction in QS
Determinants of supply
There are several factors that will change the supply of a good or service, irrespective of the price level
Collectively, these factors are called the determinants of supply and include:
Changes to the costs of production
Changes to indirect taxes and subsidies
Changes to technology
Changes to the number of firms
Weather events
Future price expectations
Goods in joint and competitive supply
Changes to any of the conditions of supply shift the entire supply curve (as opposed to a movement along the supply curve)
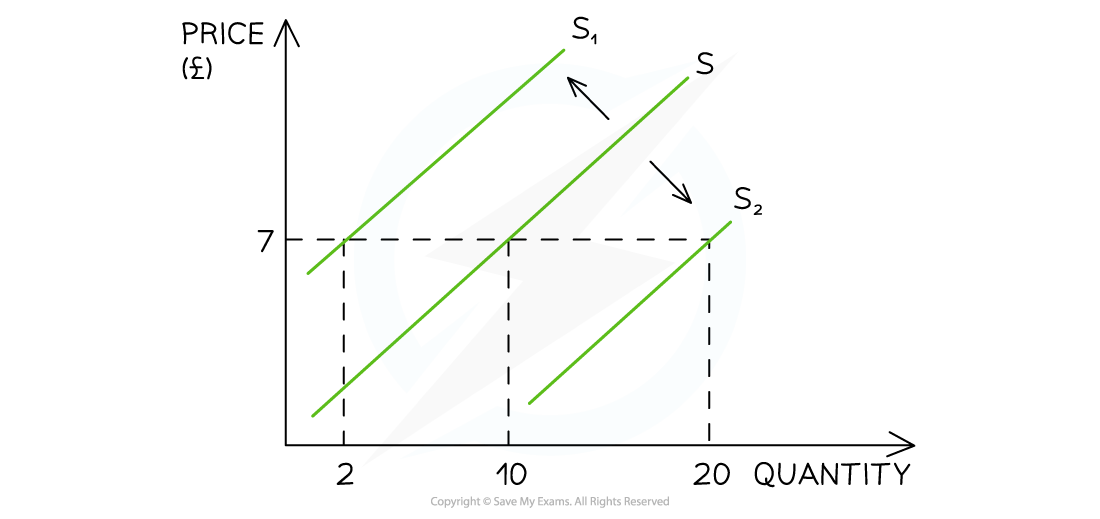
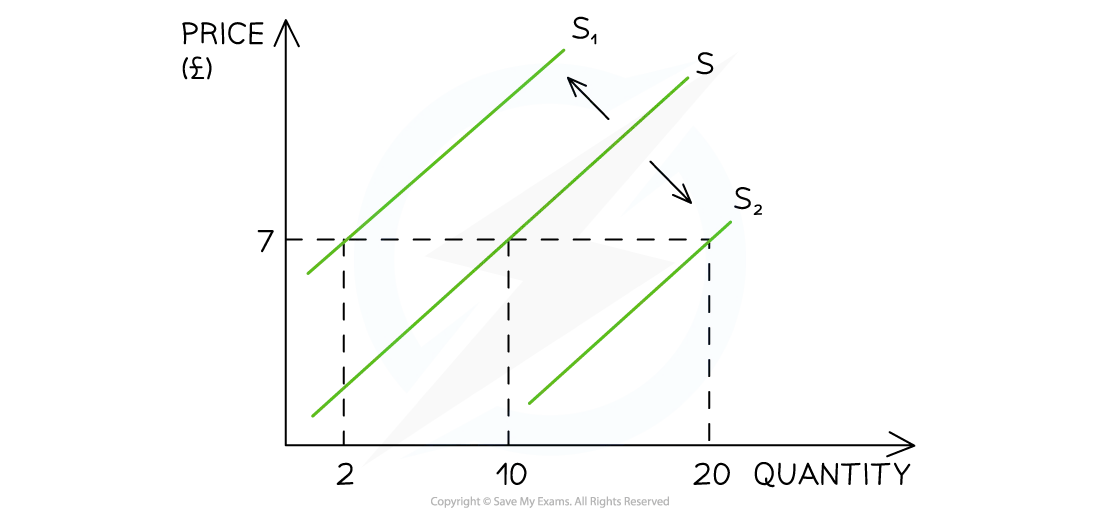
Diagram analysis
If a firm's cost of production increases due to the increase in price of a key resource, then there will be a decrease in supply as the firm can now only afford to produce fewer products
This is a shift in supply from S to S1. The price remains unchanged at £7 but the supply has decreased from 10 to 2 units
Illustrating changes to the determinants of supply
1. Changes to the costs of production
If the price of raw materials or other costs of production change, firms respond by changing supply.
If costs of production increase
Supply decreases and shifts left (S→S1)
For example, rising aluminium prices increase bicycle production costs in Malaysia, causing supply to fall
If costs of production decrease
Supply increases and shifts right (S→S2)
2. Changes to indirect taxes
Any change to indirect taxes changes the cost of production for a firm and impacts supply
If indirect taxes increase
Supply decreases and shifts left (S→S1)
For example, a higher sugar tax in Thailand raises costs for soft drink producers, reducing supply
If indirect taxes decrease
Supply increases and shifts right (S→S2)
3. Changes to subsidies
Changes to producer subsidies directly impact the cost of production for the firm
If subsidies increase
Supply increases and shifts right (S→S2)
If subsidies decrease
Supply decreases and shifts left (S→S1)
For example, the removal of farming subsidies in Argentina reduces agricultural output
4. Changes to the state of technology
New technology increases productivity and lowers costs of production
Ageing technology can have the opposite effect
If technology improves
Supply increases and shifts right (S→S2)
For example, new irrigation systems in Morocco help farmers produce more crops with less water
If technology worsens
Supply decreases and shifts left (S→S1)
5. Change in the number of firms in the industry
The entry and exit of firms into the market has a direct impact on the supply
If ten new firms start selling building materials in Hanoi, the supply of building material will increase
If the number of firms increases
Supply increases and shifts right (S→S2)
If the number of firms decreases
Supply decreases and shifts left (S→S1)
For example, several electronics factories close in South Africa due to constant power outages, reducing supply
6. Weather events
Droughts or flooding can cause a supply shock in agricultural markets
A drought will cause supply to decrease
Unexpectedly good growing conditions can cause supply to increase
If the weather is good
Supply increases and shifts right (S→S2)
For example, ideal monsoon rains boost rice production in India
If the weather is bad
Supply decreases and shifts left (S→S1)
For example, severe drought in Kenya reduces the coffee harvest, lowering supply
7. Future price expectations
If firms expect the price of a good or service to increase in the future, they will hold back supply now to sell later at a higher price
If firms expect the price of a good or service to decrease in the future, they will sell more now before prices fall
If prices are expected to rise in the near future
Supply decreases and shifts left (S→S1)
If prices are expected to fall in the near future
Supply increases and shifts right (S→S2)
Examiner Tips and Tricks
Make sure that you explain each condition as its own point before linking it to the cost of production, e.g. a change in indirect taxation
A common error by students is to explain that a subsidy shifts the demand curve for electric vehicles to the right. A subsidy will shift the supply curve to the right. The lower price, will cause a movement along the demand curve (extension of quantity demanded) to create a new market equilibrium

Unlock more, it's free!
Join the 100,000+ Students that ❤️ Save My Exams
the (exam) results speak for themselves:

Was this revision note helpful?
