Allocative & Dynamic Outcomes (Cambridge (CIE) A Level Economics): Revision Note
Exam code: 9708

Pareto efficiency
Pareto optimality/efficiency describes a situation where resources are allocated in such a way that it is impossible to make one person better off without making someone else worse off
It represents the most efficient outcome in terms of resource use and individual welfare.
Pareto optimality on a production possibility curve

Diagram explanation
This concept is often illustrated using a Production Possibility Curve (PPC), which shows the maximum combinations of two goods that an economy can produce using all available resources efficiently
Any point on the PPC, like A, B, C or D is considered Pareto optimal
Increasing the output of consumer goods from C to D would require reducing the number of capital goods produced by 50. This trade-off means resources are still fully utilised
Any point inside the PPC, like E, is Pareto inefficient
This means the economy could produce more of one or both goods without sacrificing the other
For instance, if land is underused or workers are unemployed, the country could increase production of both goods without any trade-off
Pareto improvement
A Pareto improvement occurs when at least one person becomes better off without making anyone else worse off
These improvements are desirable because they increase overall welfare without causing harm
If a city upgrades its public transport system using underutilised funds, commuters benefit from faster travel while no one else is negatively affected
Real-World trade-offs
In practice, achieving Pareto optimality can be difficult. Many decisions involve winners and losers, even if overall efficiency improves
Consider the construction of a new high-speed rail line:
Passengers and businesses benefit from quicker travel and better connectivity.
However, some residents may lose their homes due to land clearance, and others may experience increased noise or disruption
Although the project may improve national transport efficiency, it is not Pareto optimal unless those negatively affected are compensated in a way that restores their welfare
Dynamic efficiency
'Dynamic efficiency' refers to improvements in productive efficiency that occur over time
This is a long-term efficiency as a result of innovation from a firm reinvesting its profits
It results in improvements which lower both the short-run and long-run average total costs
It involves firms adapting, innovating, and investing in better methods to produce more output using fewer resources
Unlike static efficiency, which focuses on current cost minimisation, dynamic efficiency is about long-term progress and responsiveness to change
How do firms achieve dynamic efficiency?
Firms often reinvest profits into research and development, new technologies, or improved training
These investments allow them to:
Lower production costs
Increase output
Respond to consumer needs more effectively
Stay competitive in evolving markets
A company producing smartphones may invest in automated assembly lines and AI-driven quality control systems. Over time, this leads to faster production, fewer defects, and lower costs per unit
Visualising dynamic efficiency
Economists often show dynamic efficiency using long-run average cost curves
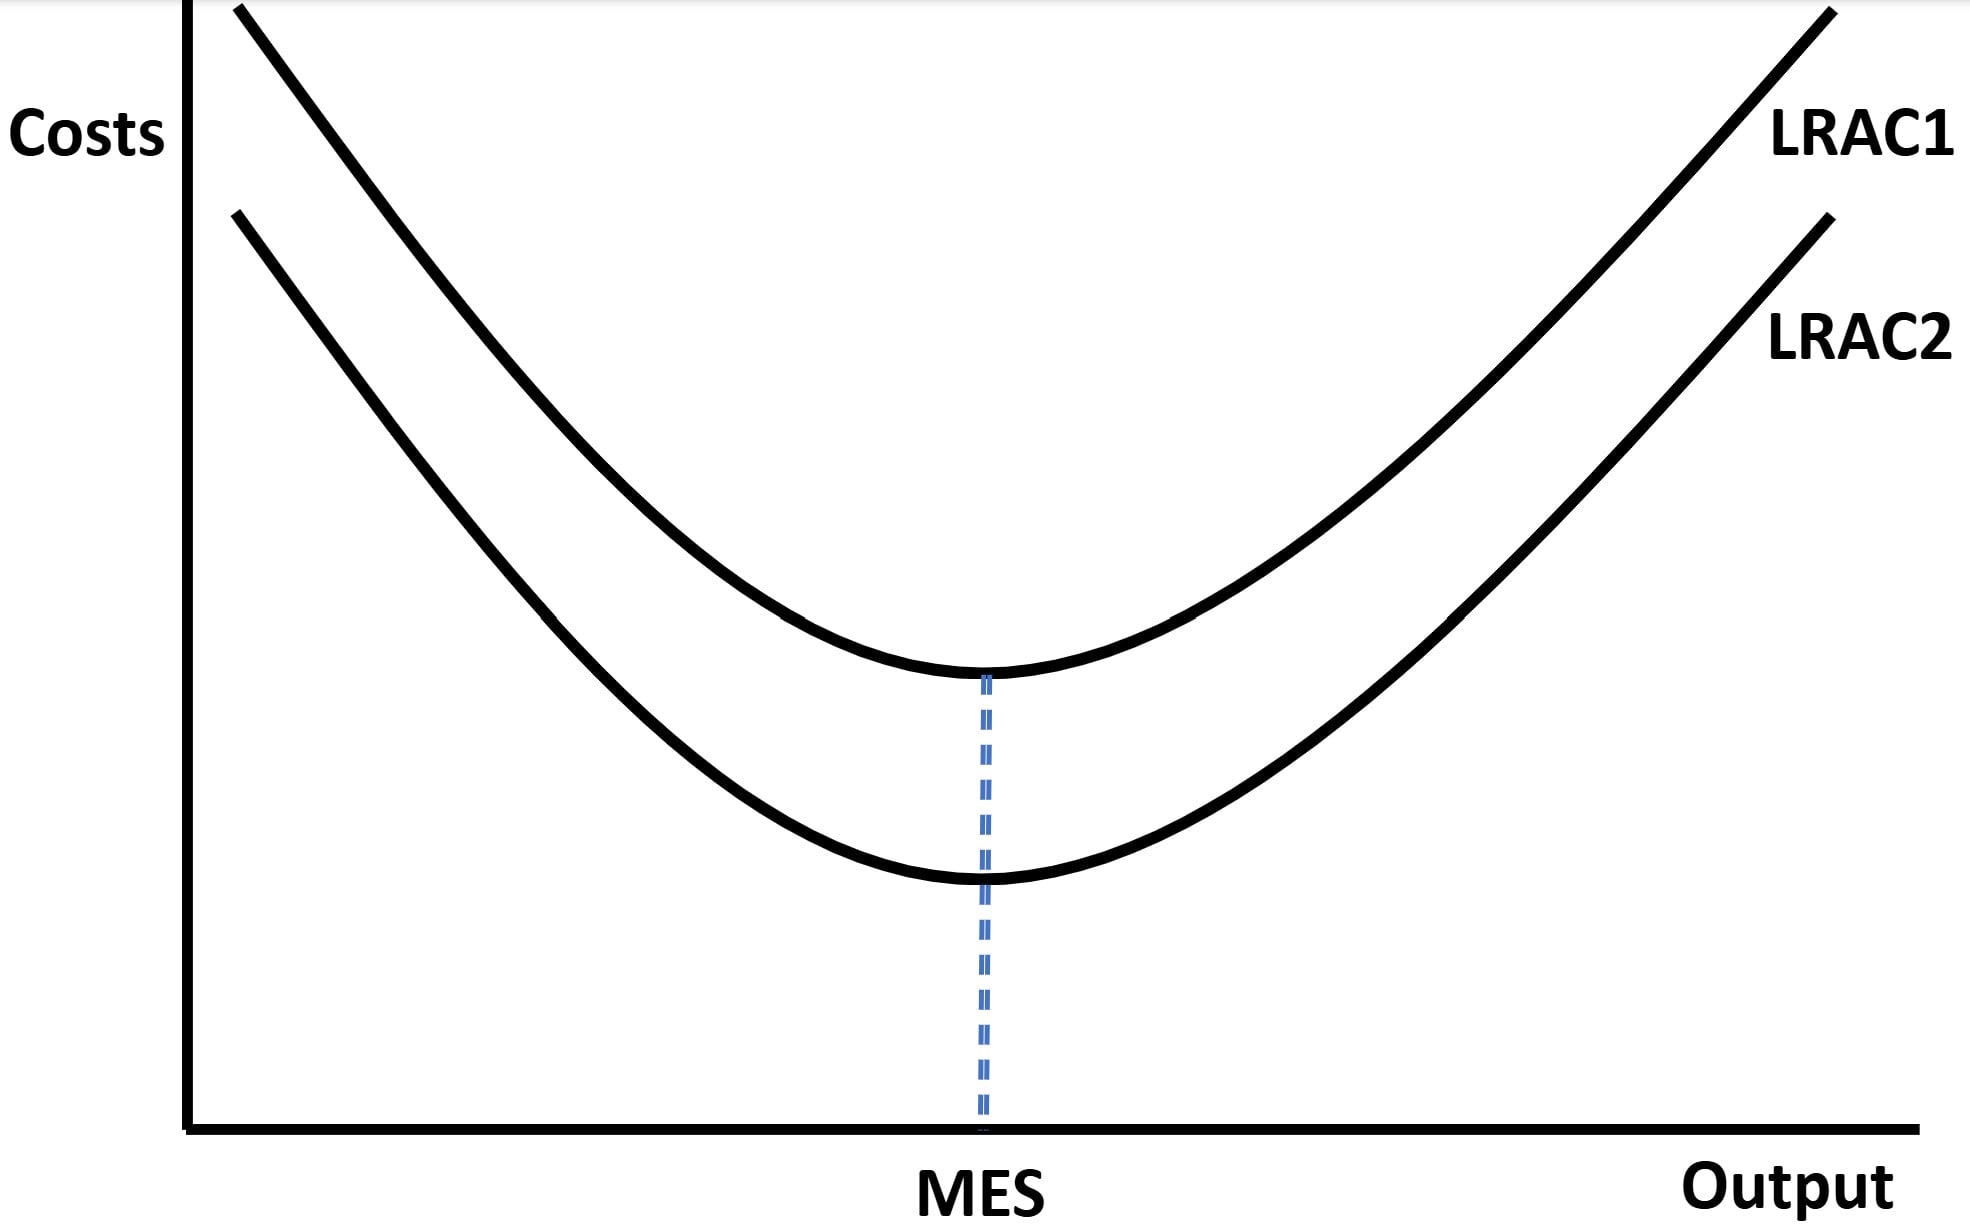
Initially, a firm operates on a higher cost curve (LRAC₁)
After innovation and investment, it shifts to a lower cost curve (LRAC₂)
This shift means that at MES the firm’s costs fall
Example
Consider the renewable energy sector:
A wind turbine manufacturer may begin with basic designs and manual assembly
Over time, it invests in robotic blade construction, advanced materials, and predictive maintenance software
These changes reduce costs, increase reliability, and allow the firm to produce more turbines with fewer inputs
Consumers benefit from cheaper electricity, and the economy benefits from cleaner energy and lower emissions

Unlock more, it's free!
Join the 100,000+ Students that ❤️ Save My Exams
the (exam) results speak for themselves:

Was this revision note helpful?
