Demographic Trends: Birth Rate (AQA A Level Sociology): Revision Note
Exam code: 7192
Birth rate
The birth rate is defined as:
the number of live births per 1,000 of the population per year
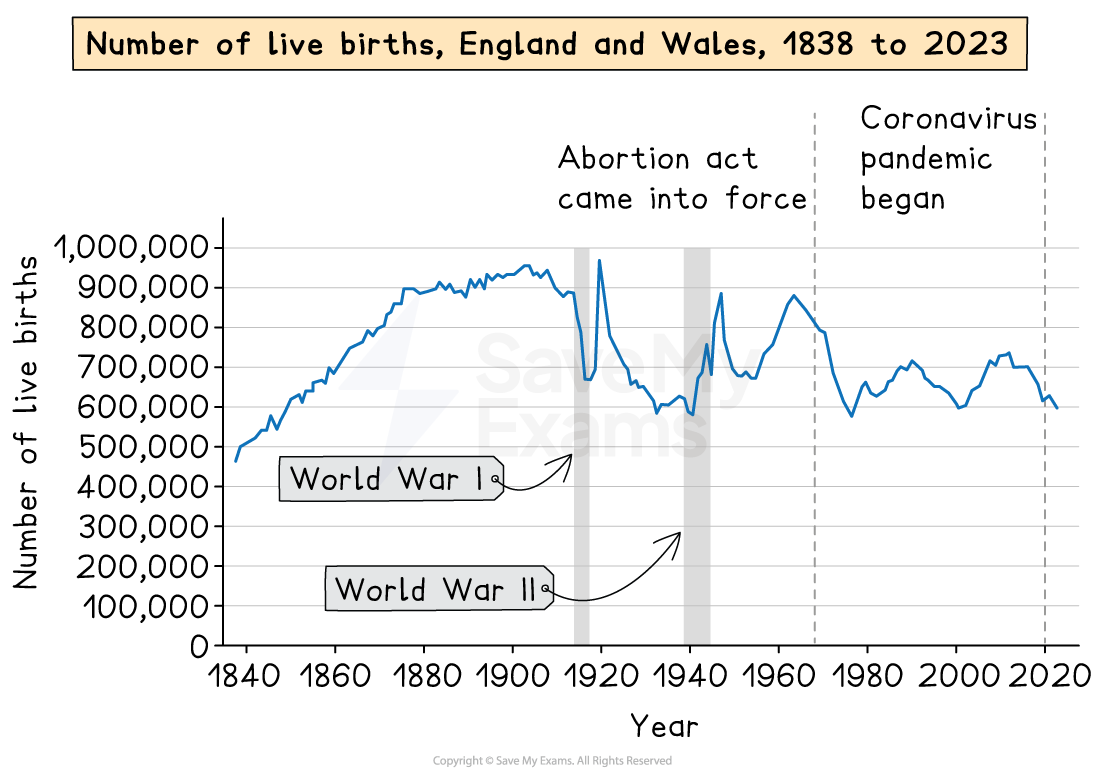
Trends in the UK since 1900:
Steady long-term decline in the birth rate since 1900 (when it was 28.7 births per 1,000 people)
The birth rate in 2023 was 10.02
This has decreased from 10.4 in 2021
There were two main baby booms:
After WW1 (1918)
After WW2 (1945–1960s)
General decline resumed from the 1970s onward
A slight increase occurred after 2001, reaching its highest rate since 1971 in 2012

Fertility rates
The fertility rate is the number of live births per 1000 women aged 15-44 over a year
Trends in the UK since 1900:
There has been a decline in fertility rates, but it has fluctuated and is currently increasing
In 1900, the fertility rate was 115 live births per 1000 women aged 15-44, compared with only 63.6 in 2009
The fertility rate has been rising over the past decade; in 2001, it stood at 54.5
This increase may be linked to the growth of immigrant families in the UK, who often have children at a younger age and tend to have larger families
Total fertility rates
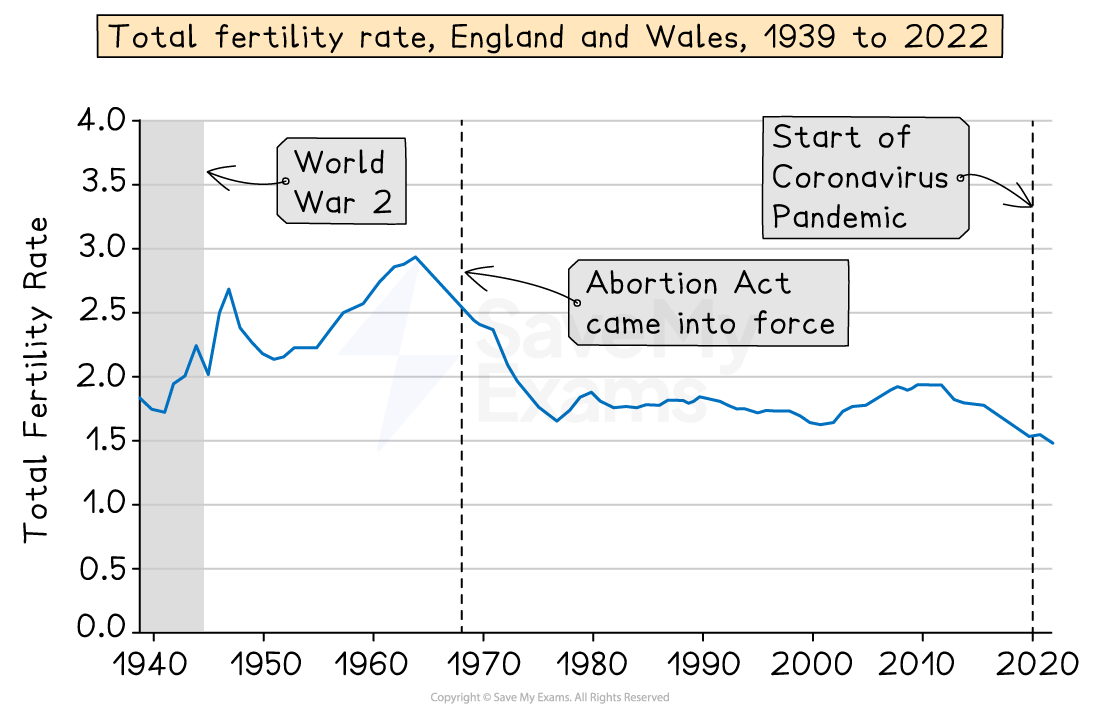
The total fertility rate (TFR) is defined as the average number of children women will have during their fertile years
Trends in the UK since 1900:
There has been a decline in total fertility rates since 1900 (when it was 3.63), and it is currently at its lowest level on record
The TFR in 2023 was 1.44 children per woman
This has decreased from 1.49 in 2022
In 2021, the TFR was 1.53
The changes in fertility and birth rates show that:
more women are remaining childless than in the past
women are delaying having children as:
the average age for giving birth is 30.9 years
fertility rates for women in their 30s and 40s are increasing
older women may have fewer fertile years remaining, so they produce fewer children

Reasons for the recent rise in the birth rate
Sociologists have identified several factors contributing to the steady increase in the UK birth rate since the early 21st century
Two key explanations include
increased migration
The rise in recent migration has contributed significantly to the increase in the birth rate
Many migrants are of childbearing age, leading to more births overall
Certain migrant groups — including Asian, African, Polish, and Irish-Catholic families — tend to have larger family sizes compared to the average white British family
economic recovery
After the global recession of 2007, the UK economy began to stabilise around 2010
This economic improvement coincided with a rise in the birth rate: in 2007, 690,013 babies were born, compared with 2012, when 729,674 babies were born
A likely reason is that couples delayed having children during times of financial uncertainty and waited until they felt more secure in their jobs before starting or expanding their families
Reasons for the decline in birth rate since 1900
Sociologists have identified a range of factors that explain the long-term decline in the UK birth rate since 1900
Decline in infant mortality rate (IMR)
Fewer children die before their first birthday, reducing the perceived need to have “extra” children as insurance against child mortality
In 1900, the IMR was 154 per 1,000 live births; by 2022, it had dropped to 3.9.
This dramatic fall is largely due to:
improved sanitation and clean water supply, reducing the spread of infectious diseases
advances in nutrition and medical care for both mothers and infants
expansion of NHS services since 1948, including maternity care, antenatal, and postnatal clinics
Economic liability
Children are increasingly seen as an economic burden rather than an economic asset
Contributing factors include:
rising costs of living, education, and childcare
legal restrictions on child labour mean children can no longer contribute economically to the household
housing costs and student debt delay financial independence and decisions around starting a family
According to The Times (2024), the average cost of raising a child to age 18 in the UK is £223,256, including housing and childcare
As a result, many parents delay having children or choose to have smaller families
Changing role of women
Greater access to education, employment, contraception, and abortion has transformed women’s life choices
Many women now prioritise careers and personal development over early motherhood
This explains the growing trend of delayed childbirth, with increasing numbers of mothers aged 35+ and 40+
There is also a rise in voluntary childlessness, especially in developed countries (Gillespie, 2003)
Family changes
Smaller families have become the norm, reflecting changing social expectations and values
The rise of dual-income households often means work commitments take priority, leading to postponed or reduced childbearing
In some family structures, such as same-sex couples, biological barriers or reliance on assisted reproductive technology can make conception more difficult, influencing birth trends
Implications of a declining birth rate
As birth and fertility rates have steadily declined since 1900, sociologists have identified several key impacts on family life, population structure, and social policy
Family size and structure
Families are becoming smaller, with parents choosing to have fewer children
By 2012, the average was 1.7 children per family
There is a significant increase in the number of older mothers, particularly those aged 40 and over
Asian families continue to have larger average family sizes (Bhatti, 1999)
Family diversity
A lower birth rate has contributed to greater family diversity, including:
lone-parent families
step-families
dual-career families
voluntary child-free families
The rise in voluntary childlessness reflects changing norms, values, and increased individual choice, especially for women
The dependency ratio
The dependency ratio refers to the relationship between the working-age population and the non-working dependent population (children and retirees)
The working population supports the dependent population through their earnings, savings, and taxes
Short-term impact:
Fewer dependent children may reduce pressure on education and child-related services
Long-term concern:
A smaller, younger generation could lead to a higher proportion of elderly dependents, increasing the burden on the working-age population
Public services & policies
A declining birth rate may result in:
fewer schools and maternity services
changes in the demand for maternity/paternity leave
adjustments to housing policy (e.g., smaller family homes)
However, an ageing population will likely increase demand for:
healthcare services
pension provision
Evaluation of declining birth and fertility rates
Liberal feminists view these trends positively:
The trends represent greater gender equality and individual freedom for women
Wilkinson (1994) refers to a ‘genderquake’ — a shift in attitudes where women no longer see motherhood as a central obligation
In contrast, the New Right criticises these changes:
They interpret the decline as a sign of moral decay and weakening of traditional family values
They attribute the decline to rising female employment and the widespread availability of contraception
Examiner Tips and Tricks
Make sure you understand the definitions of the key terms — birth rate, fertility rate, and total fertility rate — as well as the trends over time, the reasons for these changes, and the impacts or consequences outlined above.

Unlock more, it's free!
Was this revision note helpful?
