Distributions (College Board AP® Psychology): Revision Note

What is a distribution?
Distribution refers to the way in which scores are spread across a data set
How scores cluster around the mean and whether that spread is symmetrical or asymmetrical
Researchers in psychology are interested in the shape of a distribution because it affects:
which measure of central tendency is most appropriate
how standard deviation should be interpreted
what conclusions can be drawn from the data
There are three key distribution shapes:
Normal distribution — symmetrical, bell-shaped
Skewed distribution — asymmetrical, with one tail longer than the other
Bimodal distribution — two distinct peaks
Normal distribution
A normal distribution is a symmetrical, bell-shaped distribution in which most scores cluster around the mean, with progressively fewer scores toward the extremes
In a perfect normal distribution:
the mean, median, and mode are all equal and located at the peak of the curve
scores are distributed symmetrically on both sides of the mean
the curve is highest in the middle and tapers gradually toward both ends
The shape of a normal distribution is known as the bell curve
Examples of data that tends to be normally distributed:
Height
Weight
IQ scores
Reaction time
Percentage benchmarks in a normal distribution
One of the most important features of the normal distribution is that specific percentages of scores fall within each standard deviation of the mean:
Approximately 68% of scores fall within 1 standard deviation of the mean
Approximately 95% of scores fall within 2 standard deviations of the mean
Approximately 99% of scores fall within 3 standard deviations of the mean
This means that scores falling beyond 2 standard deviations from the mean are relatively rare
The occur in only about 5% of cases
Example:
IQ scores have a mean of 100 and a standard deviation of 15
Approximately 68% of people have an IQ between 85 and 115
This is within 1 SD of the mean
Approximately 95% of people have an IQ between 70 and 130
This is within 2 SDs of the mean
A score beyond 2 standard deviations from the mean (below 70 or above 130) would be considered unusually low or high
Link to z-scores
Because the normal distribution has predictable percentage benchmarks, z-scores can be used to determine exactly where a given score falls within the distribution
A z-score of +1 corresponds to approximately the 84th percentile
The score is higher than approximately 84% of all scores
A z-score of −1 corresponds to approximately the 16th percentile
The score is higher than only approximately 16% of all scores
A z-score of +2 corresponds to approximately the 98th percentile
The normal distribution and deviance
The normal distribution can be used to identify scores that deviate significantly from the norm
Scores that fall beyond 2 standard deviations from the mean may indicate an unusually high or low result, e.g.:
A very high score on an IQ test
A very high score on a depression scale following childbirth
A very low score on an empathy scale

Skewed distributions
A skewed distribution is one in which scores are not distributed symmetrically around the mean
One tail of the distribution is longer than the other
Skewed distributions occur when there are behaviors, conditions, or test scores that do not fit neatly into a normal distribution
In a skewed distribution:
The mean, median, and mode no longer have the same value and are no longer located at the same point on the curve
The mean is the measure of central tendency most affected by skew
Because it takes all scores into account, it is pulled toward the extreme scores in the longer tail
The median is less affected by skew and is therefore a more appropriate measure of central tendency for skewed data sets
The mode remains at the peak of the distribution
Positive skew
A positively skewed distribution is one in which most scores cluster toward the left (lower end) of the distribution, with a long tail extending to the right (higher end)
The mean is pulled to the right of the median and mode by the extreme high scores in the tail
In a positively skewed distribution: mode < median < mean
Examples of positively skewed data:
Scores on a very difficult exam
Most students score at the lower end, with only a few achieving high scores
Income distribution
Most people earn relatively modest incomes, with a small number of very high earners pulling the tail to the right
Reaction time data
Most responses are fast, but occasional very slow responses create a long right tail

Negative skew
A negatively skewed distribution is one in which most scores cluster toward the right (higher end) of the distribution, with a long tail extending to the left (lower end)
The mean is pulled to the left of the median and mode by the extreme low scores in the tail
In a negatively skewed distribution: mean < median < mode
Examples of negatively skewed data:
Scores on a very easy exam
Most students score at the higher end, with only a few achieving very low scores
Age at retirement
Most people retire at a similar older age, with a small number retiring unusually early creating a left tail
Hours of sleep in a healthy adult population
Most adults sleep close to 8 hours, with a small number sleeping very few hours pulling the tail to the left

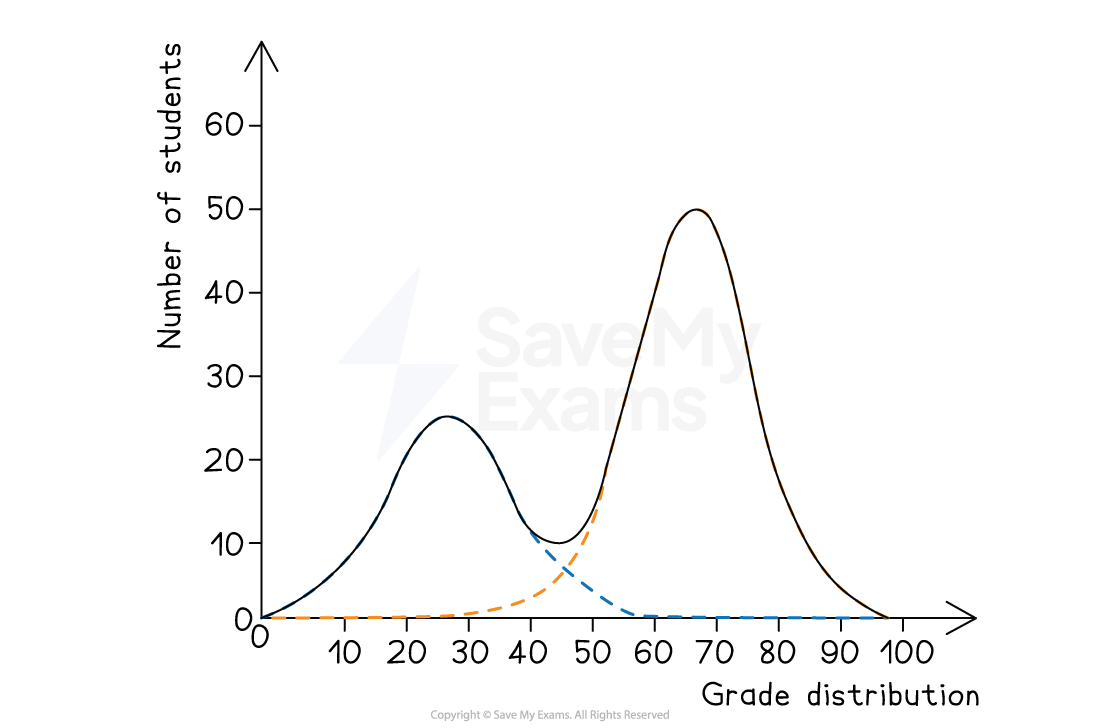
Bimodal distribution
A bimodal distribution is one that has two distinct peaks
Two values that occur with equal or near-equal frequency, both more often than any other value in the data set
A bimodal distribution suggests that the data set contains two distinct subgroups that responded differently, e.g.
A memory test administered to both young adults and older adults may produce a bimodal distribution
One peak representing the younger group's scores and one peak representing the older group's scores
A survey on attitudes toward a controversial policy may produce a bimodal distribution
One peak representing strongly favorable responses and one peak representing strongly opposed responses
When a bimodal distribution is present:
the mean may fall between the two peaks
It would not represent either subgroup accurately
the mode alone is not sufficient as a summary statistic
Both peaks should be reported
the bimodal pattern itself is a meaningful finding that warrants further investigation into why two distinct clusters of scores exist
Examiner Tips and Tricks
In the exam, if you are shown a distribution and asked to interpret it, work through four questions:
Is the distribution symmetrical or asymmetrical?
If asymmetrical, which direction is the tail pointing — left (negative skew) or right (positive skew)?
Where do the mean, median, and mode sit relative to each other — are they equal (normal), or is the mean pulled toward the tail (skewed)?
Are there one or two peaks — a single peak suggests a normal or skewed distribution; two peaks suggest a bimodal distribution

Unlock more, it's free!
Join the 100,000+ Students that ❤️ Save My Exams
the (exam) results speak for themselves:

Was this revision note helpful?
