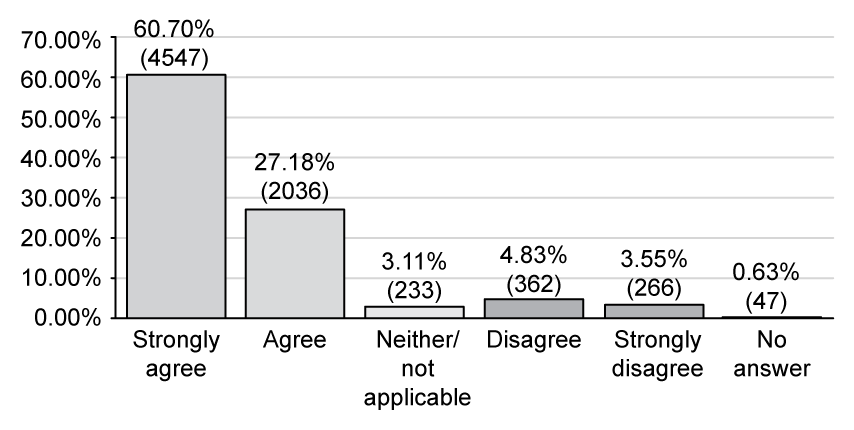
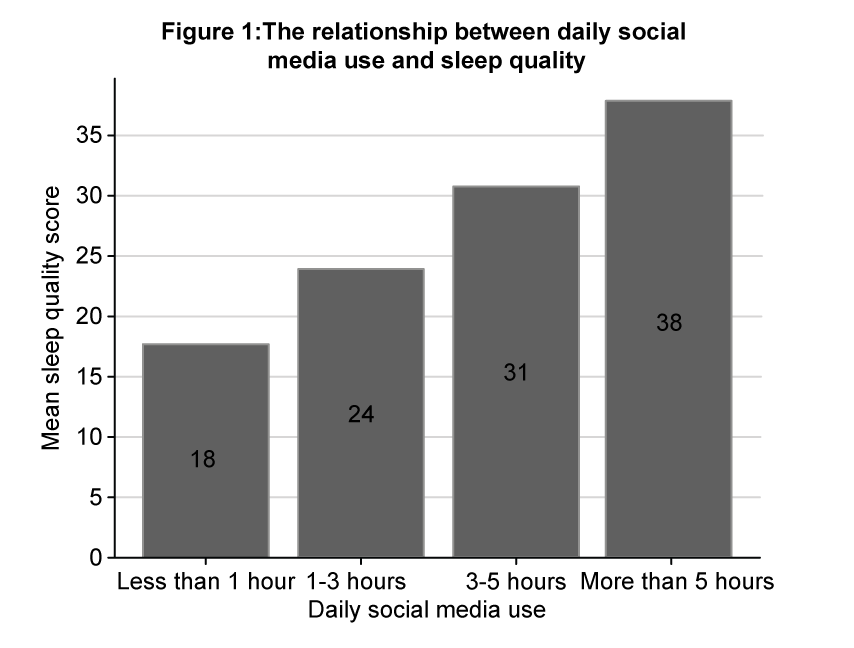
Syllabus Edition

First teaching 2025

First exams 2027

Data Analysis & Interpretation (HL Only) (DP IB Psychology: HL): Exam Questions

51 mins17 questions
1
3 marks

Source 1

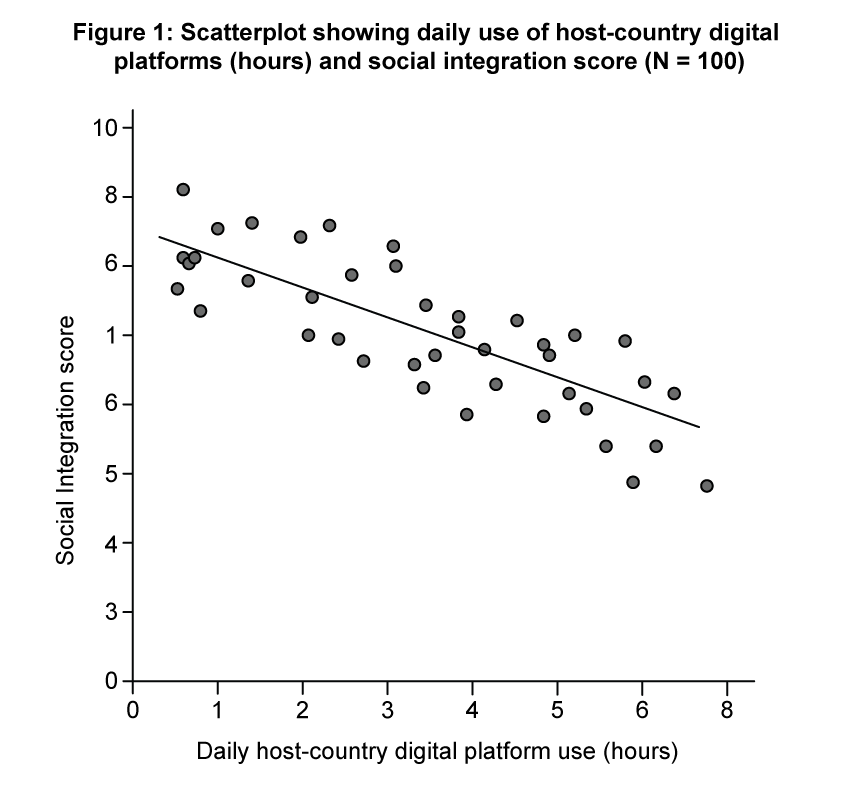
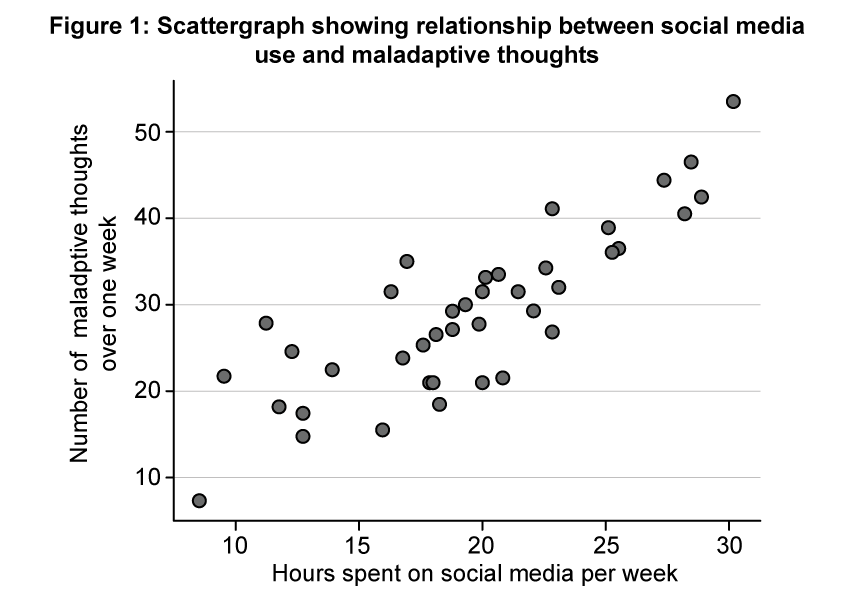
Figure 1 shows the relationship between daily social media use and self-reported sleep quality among adolescents aged 15–18 years. Sleep quality was measured using a standardised self-report scale, with higher scores indicating poorer sleep quality. Social media use was categorised based on average daily time spent on social networking platforms.

Bar chart illustrating mean sleep quality scores by daily social media use: less than 1 hour (18), 1-3 hours (24), 3-5 hours (31), over 5 hours (38).

Explain one issue that limits the interpretation of the data in source 1.

2
3 marks

Source 1

A public health researcher investigated the distribution of Body Mass Index (BMI) scores among individuals aged 18–45 from two cultural contexts: individualistic cultures and collectivist cultures.

Participants’ BMI was calculated using height and weight measurements taken during school health checks. Obesity was defined as a BMI of 30 or above.

Figure 1: Frequency distribution of BMI scores for adults aged 18-45 from individualistic and collectivist cultures.

Two histograms comparing BMI distribution in individualistic vs collectivist cultures, with normal distribution curves overlaid.

Explain one issue that limits the interpretation of the data in source 1.

3
3 marks

Source 1

Figure 1 shows the effect of different types of motivation on adherence to a physical activity programme over a 12-week period. Adherence is measured as the percentage of participants who completed the programme.

Participants were divided into three groups:

  • Intrinsic motivation (e.g. enjoyment, personal goals)

  • Extrinsic motivation (e.g. rewards, praise)

  • Amotivation (low or no motivation)

Bar chart showing adherence to a physical activity programme: 78% intrinsic motivation, 52% extrinsic, 21% amotivation.

Explain one issue that limits the interpretation of the data in source 1.

4
3 marks

Figure 1 shows levels of prosocial behaviour displayed by children aged 6–8 years following different types of feedback from adults during cooperative classroom activities.

Children were placed into three conditions:

  • Extrinsic reward (e.g. stickers, points)

  • Verbal praise (e.g. positive comments)

  • No reward or praise (control)

Prosocial behaviour was measured as the percentage of children who shared materials or helped peers during tasks.

Figure 1: Prosocial behaviour by type of extrinsic motivator

Bar chart showing percentage of children displaying prosocial behaviour: extrinsic reward 68%, verbal praise 54%, control 29%, with error bars.

Explain one issue that limits the interpretation of the data in source 1.

5
3 marks

Source 1

A study investigated the relationship between parental smartphone use during shared activities and children’s attachment security. Sixty children aged 3–5 years took part in a structured observation of attachment-related behaviours, which were scored using an age-appropriate attachment rating scale completed by trained observers. Higher scores indicated greater attachment security.

Parents were observed during a structured play session with their child and were categorised into low, moderate, or high smartphone use based on the frequency of device checking.

Box plot titled "Attachment security scores by level of parental smartphone use" shows declining scores from low to high smartphone use.

Explain one issue that limits the interpretation of the data in source 1.

6
3 marks

Source 1

Figure 1 shows the relationship between daily use of host-country digital platforms and self-reported social integration among adolescents who have recently migrated to a new country.

Participants were adolescents aged 15–18 years who had lived in the host country for less than two years. Daily technology use was measured in hours per day, based on time spent using host-country social media platforms, messaging apps, and online forums. Social integration was measured using a self-report scale assessing the number of regular social interactions with peers from the host culture.

Scatterplot depicting a negative correlation between daily digital platform use in hours and social integration scores among 100 participants.

Explain one issue that limits the interpretation of the data in source 1.

7
3 marks

Source 1

A longitudinal public health study investigated changes in obesity prevalence in two countries over a 10-year period. One country was classified as predominantly individualistic and the other as predominantly collectivist based on cultural orientation.

Obesity prevalence was calculated as the percentage of the population classified as obese in each country for each year of the study period.

Figure 2: Obesity prevalence over time by cultural context.

Line graph showing obesity prevalence from 2013 to 2022. Solid line for individualistic cultures rises sharply. Dashed line for collectivist cultures rises slowly.

Explain one issue that limits the interpretation of the data in source 1.

8
3 marks

Source 1

A study examined wellbeing scores in relation to the number of hours per week individuals spent engaging in health-promoting activities, such as exercise or mindfulness.

Wellbeing was measured using a wellbeing scale, with higher scores indicating better wellbeing. The data are presented in a line graph to show how wellbeing scores vary across increasing hour categories.

Line graph showing wellbeing scores increasing with hours in health-promoting activities, peaking at 6 hours before stabilising at 30 points.

Explain one issue that limits the interpretation of the data in source 1.

9
3 marks

A study examined levels of peer cooperation in classrooms in relation to how frequently teachers used extrinsic rewards over the course of a school term. Extrinsic rewards included strategies such as praise, stickers, or points.

Peer cooperation was measured using a cooperation score, with higher scores indicating greater levels of cooperative behaviour among students.

The data are presented in a line graph to show how peer cooperation varies across different frequencies of extrinsic reward use.

Line graph showing peer cooperation score increasing with reward frequency, peaking at moderate, then decreasing. Scores range from 0% to 100%.

Explain one issue that limits the interpretation of the data in source 1.

10
3 marks

Source 1

A survey was conducted to examine migrants’ perceptions of the role of technology in the process of acculturation. Participants (N = 500) responded to the statement “Using digital technology has helped me adapt to life in the host country” using a five-point Likert scale ranging from strongly disagree to strongly agree.

The distribution of responses is shown in Figure 2, which presents the number of respondents selecting each response option.

Histogram showing the number of respondents by agreement level to the statement about technology aiding adaptation in the host country.

Explain one issue that limits the interpretation of the data in source 1.

11
3 marks

Source 1

A study investigated the relationship between time spent on social media and maladaptive thoughts over a one-week period.

Participants reported the number of hours they spent on social media per week, as well as the number of maladaptive thoughts they experienced during the same time frame. The results are shown in Figure 1.

Scattergraph showing positive correlation between hours on social media and number of maladaptive thoughts over one week, with data points increasing evenly.

Explain one issue that limits the interpretation of the data in source 1.

12
3 marks

Source 1

A researcher was interested in seeing if intelligence was higher than average in adolescents who regularly play multitasking computer games.

A sample of 50 participants aged 14-17 completed a standardised IQ test. The results are shown in Figure 1.

Histogram of IQ scores for adolescents playing multitasking computer games, showing scores from 70 to 140, with a normal distribution curve.

Explain one issue that limits the interpretation of the data in source 1.

13
3 marks

Source 1

Research was conducted into how motivated smokers are to quit smoking according to age.

Participants completed a questionnaire that produced a motivation score, which was then converted into a percentage for each age group. The results are shown in Figure 1.

Bar chart showing motivation to quit smoking by age: 18-25 (60%), 25-40 (50%), 40-60 (45%), over 60 (40%), each with error bars.

Explain one issue that limits the interpretation of the data in source 1.

14
3 marks

Source 1

A survey study examined autistic adolescents’ perceptions of how autism spectrum disorder (ASD) relates to their motivation to work hard at school. Participants responded to the statement “My ASD motivated me to work hard at school.”

Responses were given on a Likert scale ranging from strongly agree to strongly disagree. Results were recorded as percentages. Figure 1 shows the percentage of participants selecting each response option.

Figure 1: Percentage of autistic adolescents endorsing different levels of agreement with the statement “My ASD motivated me to work hard at school”

Bar chart showing survey results: 60.7% strongly agree, 27.18% agree, 3.11% neither, 4.83% disagree, 3.55% strongly disagree, 0.63% no answer.

Explain one issue that limits the interpretation of the data in source 1.

15
3 marks

Source 1

A study examined memory recall performance in two cultural groups using a word-list memory task. Participants from the Kpelle community in Liberia and participants from the USA were asked to recall items from a presented word list, and the number of items correctly recalled was recorded.

Graph showing memory recall scores: solid line for Western participants peaking at 10, dashed line for Kpelle participants peaking at 7.5.

Explain one issue that limits the interpretation of the data in source 1.

16
3 marks

Source 1

Figure 1 shows data examining the relationship between strength of cultural identification and self-concept clarity in adolescents from different cultural contexts.

Line graph shows mean self-concept clarity scores rising with cultural identification levels; individualistic scores highest, followed by collectivist, then bicultural.

Explain one issue that limits the interpretation of the data in source 1.

17
3 marks

Source 1

Research was conducted into a possible relationship between regular computer gaming and working memory.

A researcher obtained a purposive sample of regular computer gamers and asked them to log the number of hours spent gaming per week. She also gave the participants a standardised test of working memory. The results are shown in Figure 1.

Scatter plot showing a positive correlation between hours spent gaming weekly and working memory scores, ranging from 50 to 75.

Explain one issue that limits the interpretation of the data in source 1.