1
3 marks
Identify and describe one way sociologists attempt to measure the dark figure of crime.
Was this exam question helpful?
Exam code: 8192
Identify and describe one way sociologists attempt to measure the dark figure of crime.
Was this exam question helpful?
What term is commonly used by sociologists to describe the amount of crime that goes unreported to the police?
Dark figure
Estimated figure
Official figure
Recorded figure
Was this exam question helpful?
Item A
A hate crime is when an individual commits a crime against another person because of a perceived difference, eg disability, gender, ethnicity, religion or sexual orientation. In recent years there has been some concern that this type of crime has significantly increased. In 2018, the Inspectorate of Police commissioned a report into how victims of hate crime believed that they had been treated by the police. 26 recent victims of hate crime, who were of mixed ages and gender were interviewed, from all over the UK. Some of those interviewed were victims of hate crime because of more than one characteristic, eg their ethnicity and their sexual orientation. Source: Her Majesty’s Inspectorate of Constabulary and Fire & Rescue Services, Understanding the Difference: the initial police response to hate crime (2018) |
From Item A, examine one weakness of the research.
Was this exam question helpful?
Item A
A hate crime is when an individual commits a crime against another person because of a perceived difference, eg disability, gender, ethnicity, religion or sexual orientation. In recent years there has been some concern that this type of crime has significantly increased. In 2018, the Inspectorate of Police commissioned a report into how victims of hate crime believed that they had been treated by the police. 26 recent victims of hate crime, who were of mixed ages and gender were interviewed, from all over the UK. Some of those interviewed were victims of hate crime because of more than one characteristic, eg their ethnicity and their sexual orientation. Source: Her Majesty’s Inspectorate of Constabulary and Fire & Rescue Services, Understanding the Difference: the initial police response to hate crime (2018) |
Describe the type of data shown in box Item A. Identify and explain one factor that may explain an increase in police-recorded hate crime.
Was this exam question helpful?
Robert Merton wrote about deviance and how it related to the culture and structure of society. He believed that in society, all groups shared the same goals, but were prepared to use different and sometimes illegitimate means to achieve them. The working of this process can be seen through some sporting examples where players use illegitimate but efficient means to win the game. For example, the star footballer who fakes injury in order to win a penalty, or the athlete who uses performance enhancing drugs. Winning the game becomes more important than playing by the rules. Source: Robert Merton, Social Theory and Social Structure, New York Press (1968) |
Identify and explain why not all crime is included in official statistics.
Was this exam question helpful?
Item A
The Crime Survey for England and Wales (CSEW) is a large-scale victim survey, conducted by the government since 1981. It measures the amount of crime in England and Wales by asking people about the crimes they have experienced during the past year. The sample size is approximately 50,000 respondents.
Percentage of adults who were victims of crime by age, year ending March 2020.
Age group | Adults who were victims of crime (%) |
16–24 | 23.7 |
25–34 | 22.3 |
35–44 | 21.5 |
45–54 | 21.1 |
55–64 | 19.2 |
65–74 | 13.8 |
75+ | 9.2 |
Source: Office for National Statistics
Describe the type of survey in Item A. Identify the age group most likely to be victims of crime and explain one factor which may account for this.
Was this exam question helpful?
Identify and explain one advantage of using self-report studies to investigate crime.
Was this exam question helpful?
Identify and describe one way sociologists attempt to measure the dark figure of crime.
Was this exam question helpful?
What term is commonly used by sociologists to describe the amount of crime that goes unreported to the police?
Dark figure
Estimated figure
Official figure
Recorded figure
Was this exam question helpful?
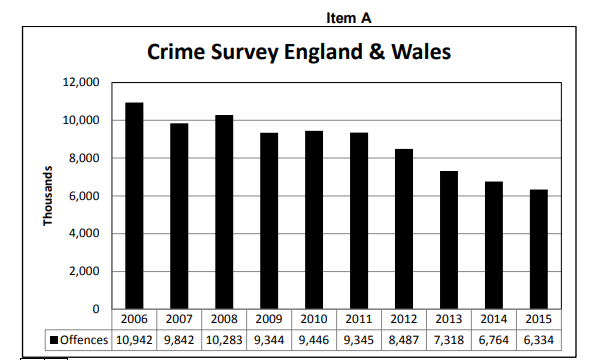
Describe the type of crime survey in Item A. Identify the trend shown by the data and explain one factor which may account for this trend.
Was this exam question helpful?