Police Recorded Crime Statistics (WJEC Eduqas GCSE Sociology): Revision Note
Exam code: C200

Official statistics on crime
Official statistics of crime recorded by police forces in England and Wales are reported to the Home Office and published by the Office for National Statistics (ONS). They include:
Police-recorded crime – offences reported to and logged by the police
Crime Survey for England and Wales (CSEW) – a large-scale victimisation survey of around 47,000 randomly selected households
Captures crimes that may not be reported to the police
Participants aged 16 and over are asked about their experiences of different crimes in the 12 months prior to the interview
Crime patterns & trends
Official Criminal Statistics (OCS) are used to show trends and patterns in crime
They tell us about the:
volume of crime (how much there is and whether it is going up or down)
main types of crime being committed
social characteristics of people who are reported, arrested, or convicted
Volume of crime
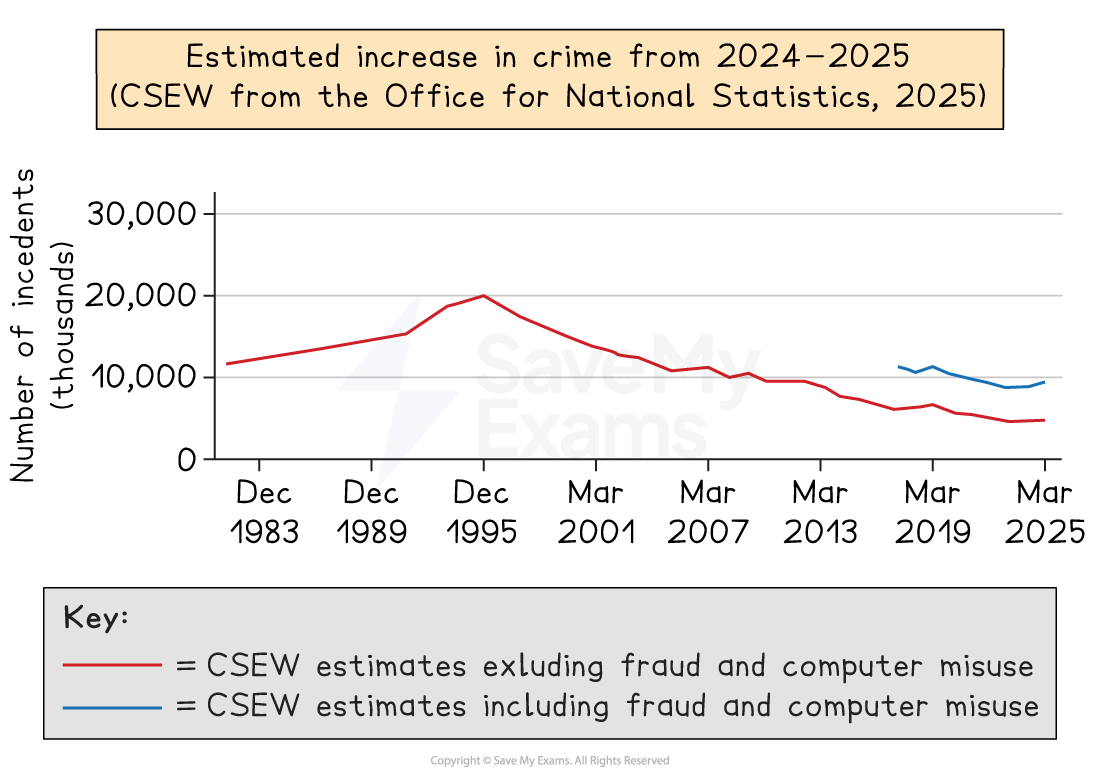
The CSEW headline estimate of crime rose by 7% in the year ending March 2025, compared to March 2024 — from 8.8 million to 9.4 million incidents
This increase was mainly due to fraud (+31%), while computer misuse fell by 32% (ONS, 2025)
Police-recorded offences stayed almost the same: 6.6 million in March 2025 vs 6.7 million the year before (ONS, 2025)
Main types of crime
Crimes against people, e.g., violence, robbery, and sexual offences
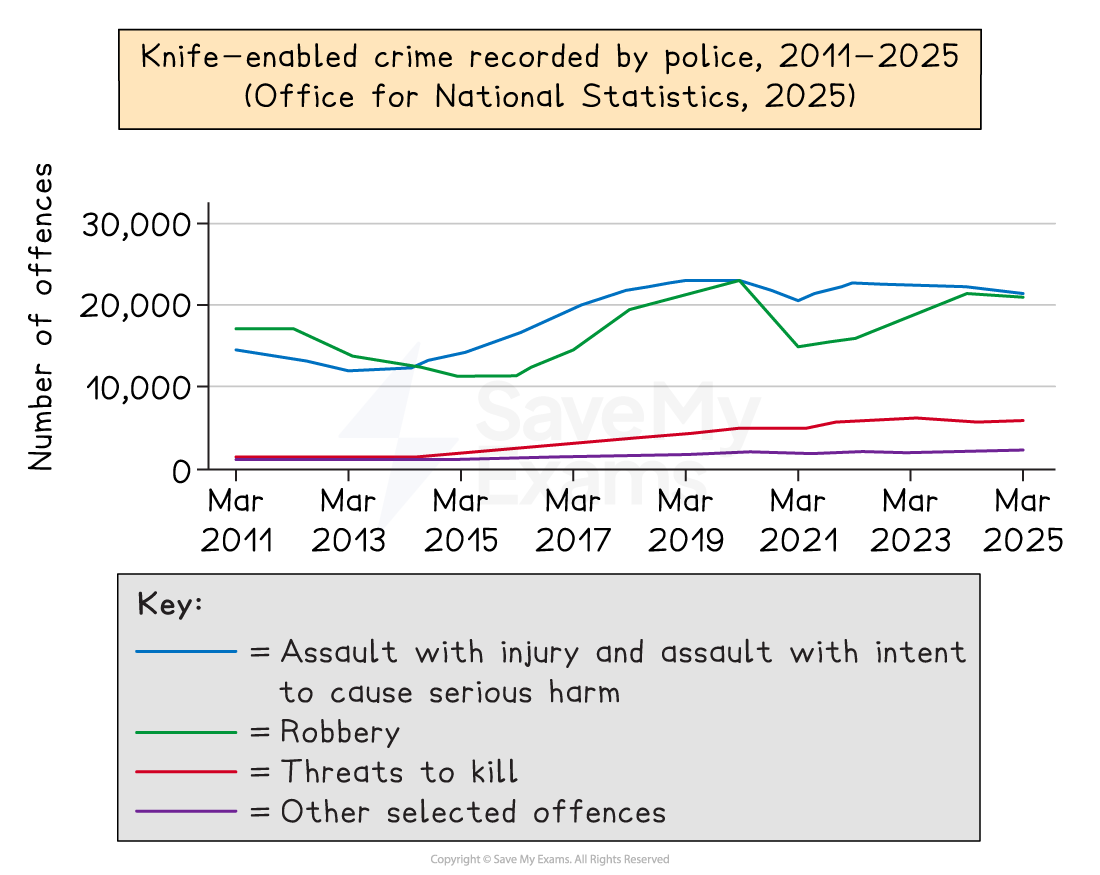
Knife crime: police records show a slight fall in 2025, after increases in the late 2010s (ONS, 2025)
Crimes against property, e.g., theft, burglary, criminal damage
Property crime is much lower than in the mid-1990s: about 608,000 incidents in 2025 compared with 3.4 million in 1995 (ONS, 1995; 2025)
'Typical' social characteristics
This means the characteristics that are most often seen among people recorded in official statistics
It is important to remember these are patterns, not descriptions of every individual who commits a crime
Gender: In 2023/24, 84% of arrests were male and 16% female (ONS)
Men were around six times more likely to be arrested than women in 2022/23
Ethnicity: In 2022/23, Black people were 2.2 times more likely to be arrested than White people (20.4 vs 9.4 per 1,000)
Rates for Black men were 38.2 per 1,000 vs 16.0 for White men (ONS)
Age: Young adults are heavily represented in serious violence cases
Class and area: OCS suggest many offenders come from working-class backgrounds and urban areas
Differences in arrest and conviction rates by sex, ethnicity, and class do not simply reflect who commits a crime
The ONS warns that they are influenced by:
policing practices and priorities
where crime is concentrated
population structures (age, gender balance)
social and economic inequalities
Usefulness of police-recorded crime statistics
Official police-recorded statistics give an inaccurate picture of how much crime actually happens
Sociologists argue they are not fully useful for showing the true level of crime in society
Not all crimes are detected or witnessed
Crimes that are unseen or unknown can’t be reported — these are “invisible crimes"
E.g., domestic violence, online fraud, drug dealing
Some crimes are dealt with privately
Crimes discovered in workplaces (e.g. theft or fraud) may be handled internally
Employers may fire the employee instead of reporting it to the police
These crimes are not recorded officially, so they don’t appear in statistics
Underreporting by victims
Many victims choose not to report crimes to the police
Reasons include:
seeing the crime as too minor (e.g., petty vandalism, bike theft)
believing the police can’t or won’t act (e.g., hate crime)
feeling there was no real loss
thinking the police won’t handle it sensitively (e.g., sexual assault)
fear of consequences, especially in domestic violence
embarrassment, e.g. in online scams or dating fraud
This means official statistics often show less crime than the Crime Survey for England and Wales (CSEW)
Not all reported crimes are recorded
Even when reported, some crimes are not recorded because:
the police think it’s too trivial
they doubt the honesty or accuracy of the report
they believe there’s not enough evidence
The "dark figure" of crime
The “dark figure” refers to unreported and unrecorded crimes
These hidden crimes mean official statistics are incomplete
Sociologists, therefore, treat police statistics with caution
Interpreting trends carefully
Increases in police-recorded crime don’t always mean more crime is happening — they could reflect:
better recording practices by the police
greater awareness of certain crimes (e.g., violence against women)
improved police sensitivity, encouraging more victims to report (e.g., hate crimes)
These factors make it difficult to compare trends over time

Unlock more, it's free!
Join the 100,000+ Students that ❤️ Save My Exams
the (exam) results speak for themselves:

Was this revision note helpful?
