Demand, Supply & Market Equilibrium (Edexcel IGCSE Economics): Exam Questions

Exam code: 4EC1

2 hours35 questions
13 marks

Figure 1 shows the market for solar panels.

Using the diagram below, draw the likely effects on the market for solar panels if the government removes an indirect tax on them. Label the new curve, the new equilibrium price and the new equilibrium quantity.

Figure 1
21 mark

Which one of the following diagrams shows excess supply?

  • A
  • B
  • C
  • D
33 marks

Figure 1 shows the market for tennis balls.

Using the diagram below, draw the likely effects on the market for tennis balls after a fall in the price of tennis rackets. Label the new curve, the new equilibrium price and the new equilibrium quantity.

Figure
41 mark

Which one of the following diagrams shows excess demand?

  • a1
  • b1
  • c1
  • d1
53 marks

Figure 1 shows the market for rice.

Using the diagram below, draw the likely effect of an increase in the population on the market for rice. Label the new curve, the new equilibrium price and the new equilibrium quantity.

Fig 1
61 mark

Which one of the following is most likely to cause a shift to the left of the demand curve?

  • Increased advertising

  • Cost reductions

  • Increased indirect taxes

  • Decreased incomes

72 marks

A factory has been unable to meet the demand for its product due to a shortage of raw materials. The quantity demanded for the product during each of the first three months of 2024 is shown in Table 1.

Table 1

Month

Quantity of products demanded

January

13,600

February

14,200

March

11,700

Calculate the excess demand for the product for the first three months of 2024,if the quantity supplied during each month was 11,000 (33,000 in total). You are advised to show your working.

83 marks

Figure 1 shows the market for trainers.

Using the diagram below, draw the likely effects on the market after a popular celebrity was seen wearing trainers. Label the new curve, the new equilibrium price and the new equilibrium quantity.

Fig 1
96 marks

A tagine is a type of cooking pot which is used to make meals throughout Morocco. Almost every home in Morocco has one. They have also become an increasingly popular purchase for tourists who want to take home a souvenir of their travels. Producers can sell tagines in markets all over Morocco. However, as demand has increased, many have chosen to sell in the areas visited by tourists, such as Marrakesh.

With reference to the data above and your knowledge of economics, analyse how the equilibrium price of tagines sold to tourists is determined.

102 marks

What is meant by the term supply?

113 marks

Using the diagram below, draw the likely effect on the market for luxury holidays after a fall in income. Label the new curve, the new equilibrium price and the new equilibrium quantity.

Figure
12a1 mark

Figure 1 below shows a change in demand for tickets to a sporting event.

Fig 1

Which one of the following statements is true?

  • When the price falls, the quantity demanded falls

  • The demand curve slopes upwards from left to right

  • An increase in demand is shown by a shift to the right

  • A decrease in demand is shown by a shift to the right

12b1 mark

Define the term excess supply.

133 marks

Using the diagram below, draw the likely effects on the market for apples following a decrease in the price of bananas. Label the new curve, the new equilibrium price and the new equilibrium quantity.

Fig 1
143 marks

Figure 2 shows the supply of wheat in a region during 2019.

Fig 2

Explain one effect on the supply curve of wheat following a change in the price of wheat.

152 marks

A restaurant in Cyprus can seat 136 diners each evening. The demand for seats from diners over three evenings is shown in Table 1.

Table 1

Evening

Quantity of seats demanded

Thursday

98

Friday

114

Saturday

107

Calculate the excess supply of seats if the quantity supplied during these three evenings totalled 408. You are advised to show your working.

16a1 mark

State one reason why a demand curve will shift to the left.

16b3 marks

Using the diagram below, draw the likely effects on the market for crops after farmland is damaged by flooding. Label the new curve, the new equilibrium price and the new equilibrium quantity.

Figure 1
173 marks

Figure 3 shows the demand for cocoa beans during 2019.

demand for cocoa beans

Explain one effect on the demand curve for cocoa beans following a change in the price.

182 marks

A concert venue in Malaysia holds a maximum of 3,200 people for each performance. The quantity of tickets demanded for the most recent concerts is shown in Figure 5.

Concert

Quantity of tickets demanded

A

4,200

B

6,000

C

3,250

Figure 5

Calculate the excess demand for tickets if the quantity supplied for all three concerts totals 9,600. You are advised to show your working.

193 marks

Using the diagram below, draw the likely effects on the market for cars of the introduction of more effective technology in production. Label the new curve, the new equilibrium price and the new equilibrium quantity.

Figure 1
20a1 mark

Which one of the following factors may cause a shift of the demand curve?

  • Costs of production

  • Demographic changes

  • Subsidies

  • Changes in price

20b6 marks

In the capital of Laos, Vientiane, residents and tourists can now use the LOCA app to hire a taxi. Figure 4 shows the excess supply of LOCA drivers working in an area of the city when the price of a journey is 10000 Kip.

Figure 4

With reference to the data above and your knowledge of economics, analyse how market forces can remove excess supply.

212 marks

Figure 5 shows the population in Austria in the years 2000, 2008 and 2018.

Year

Population

2000

8,069,276

2008

8,341,532

2018

8,891,388

Figure 5

Calculate, to two decimal places, the percentage change in the population in Austria between 2000 and 2018. You are advised to show your working.

223 marks

Using the diagram below, draw the likely effects on the market for smartphones following a rise in the cost of raw materials. Label the new curve, the new equilibrium price and the new equilibrium quantity.

Figure 1

The New Zealand Government is to introduce new legislation to limit the interest rate firms can charge on loans made to customers. The maximum interest rate firms can charge will be 0.8% per day.

Explain one reason why the New Zealand Government may be introducing this legislation.

236 marks

During the 2019 Cricket World Cup, supporters of teams such as India, Bangladesh, England, Pakistan and Sri Lanka watched matches at stadiums and on television around the world. Pepsi was one of the main advertisers during the event.

With reference to the data above and your knowledge of economics, analyse how the demand curve for Pepsi might have been affected during the 2019 Cricket World Cup.

243 marks

Using the diagram below, draw the likely effects of an increase in income on the equilibrium price and quantity for wireless headphones. Label the new curve, the new equilibrium price and quantity.

Figure 1
253 marks

Using the diagram below, draw the effects on the equilibrium price and quantity after the government removes an indirect tax on sustainable fuel. Label the new curve, the new equilibrium price and quantity.

price
261 mark

Which one of the following diagrams shows excess supply?

  • A
  • B
  • C
  • D
27a1 mark

Which one of the following options shows the effects on the market for motorcycle helmets after a fall in the price of motorcycles?

  • A
  • B
  • C
  • D
27b2 marks

Private facilities in which swimmers can change clothes are available at the swimming pool in Ciney, Belgium. The quantity demanded for these facilities during each of the first three months of 2019 is shown in Figure 1.

Month

Quantity of private facilities demanded

January

3,600

February

3,200

March

3,100

Figure 1

Calculate the excess demand for private changing facilities for the first three months of 2019 if the quantity supplied during each month was 3,000 (9,000 in total). You are advised to show your working.

27c3 marks

Using the diagram below, draw the likely effects on the market for bread after a decrease in the population. Label the new curve, the new equilibrium price and the new equilibrium quantity.

Bread
281 mark

Which one of the following is most likely to cause a shift to the left in the supply curve?

  • Increased indirect taxes

  • Cost reductions

  • Increased subsidies

  • Decreased advertising

29a1 mark

Which one of the following diagrams shows the new equilibrium price and quantity for lemon ice cream in Thailand following a price reduction in chocolate ice cream?

  • A
  • B
  • C
  • D
29b2 marks

Tour guides are available to accompany tourists who visit the Terracotta Army collection of sculptures in Xi’An, China. The quantity of tour guides demanded for the first three months of 2019 is shown below.

Month

Quantity of tour guides demanded

January

1,200

February

1,450

March

1,625

Figure 1

Calculate the excess supply of tour guides if the quantity supplied during this three‐month period was 6,000 (2,000 per month). You are advised to show your working.

29c3 marks

Using the diagram below, draw the likely effects of an increase in the birth rate on the market for toys. Label the new curve, the new equilibrium price and the new equilibrium quantity.

Price
29d6 marks

A powerful typhoon destroyed property on the island of Lamma in Hong Kong. Owners of restaurants that were damaged think it may take two or three months for them to fully reopen. This was due to flood damage and replacing equipment that was washed away. The repair costs for one restaurant owner was an estimated HK$300000 to HK$400000.

(Source adapted from: https://www.scmp.com/news/hong-kong/society/article/ (opens in a new tab)2164928/long-road-recovery-hong-kongs-outlying-islands-after-typhoon)

With reference to the data above and your knowledge of economics, analyse how natural factors such as adverse weather may cause a shift in the supply curve.

302 marks

What is meant by the term demand?

313 marks

Using the diagram below, draw the effects on the market for crops after a hurricane destroys farm land. Label the new curve, new equilibrium price and new equilibrium quantity.

crops
32a1 mark

State one factor that will cause a demand curve to shift to the left.

32b3 marks

Beating the congestion in Dhaka

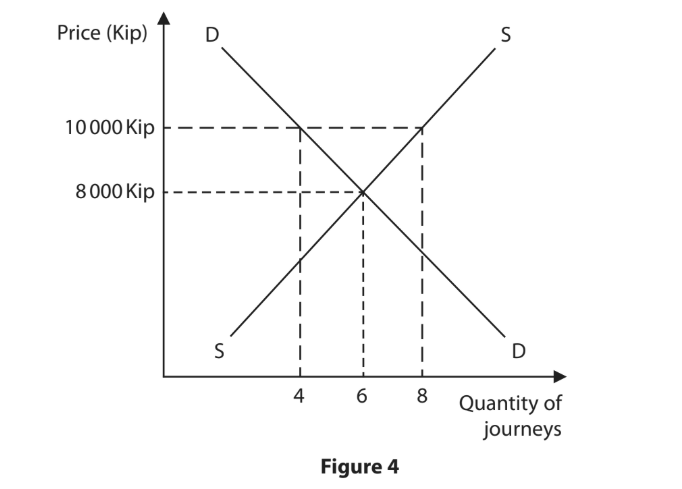
Nearly 17 million people live in Dhaka, the capital of Bangladesh. The majority of people live in the city centre and traffic congestion is a problem. However, there are many auto rickshaws (a small, three-wheeled vehicle, driven by a motorcycle engine) competing in the city centre to take passengers to their destinations. Fares tend to be cheaper in the city centre than they are outside the city centre and are usually agreed between passengers and drivers.

Dhaka has a large number of auto rickshaws competing for fares.

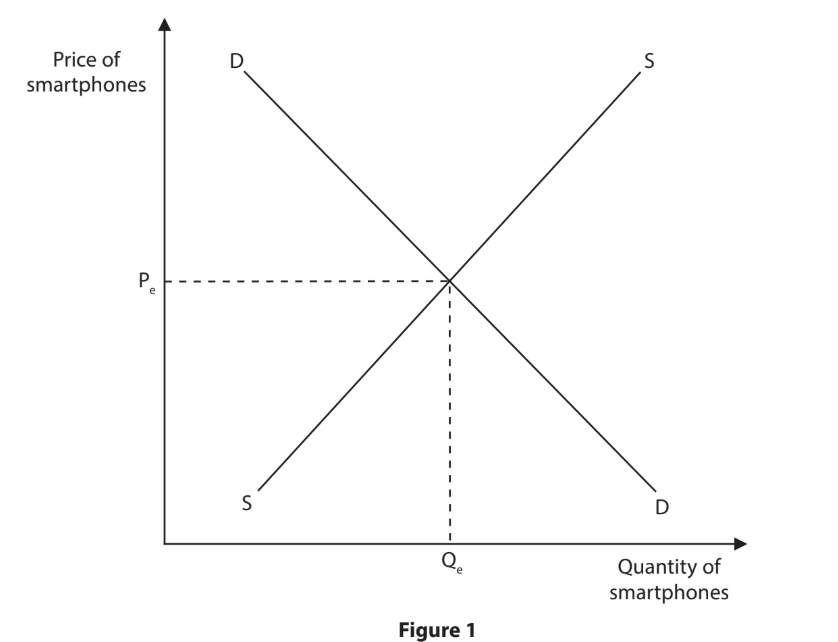
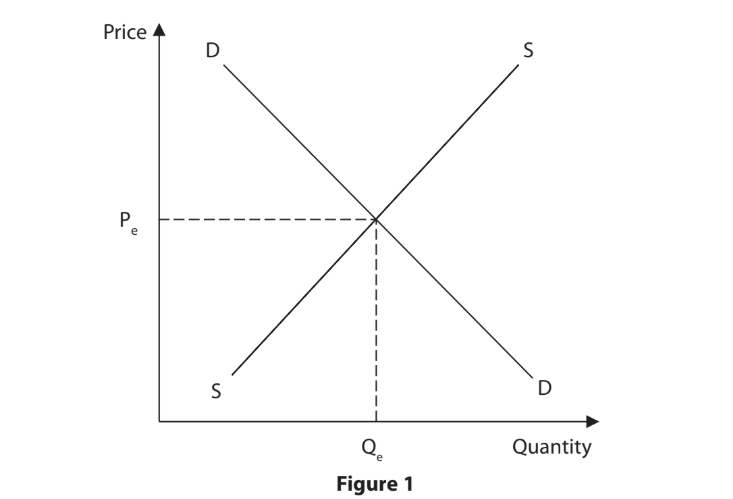
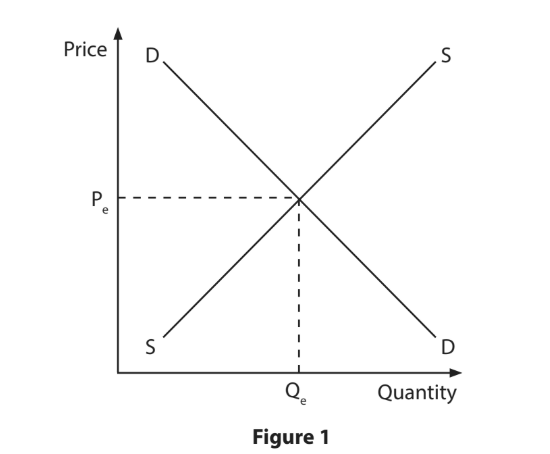
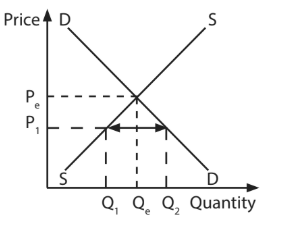
With reference to the information given in ‘Beating the congestion in Dhaka’, explain one reason why prices for journeys using an auto rickshaw might be higher outside the city centre.

32c9 marks

A lack of space in many busy cities means parking is an increasing problem. Japan has developed the first Automated Parking Systems (APS). These are car parks where the cars are automatically stacked. The driver takes the car to the entrance, then technology takes over, placing each car on racks, one above the other. This allows many cars to be parked in a very small area. Not only do they offer a more practical use of space than traditional multi-storey car parks, but they cost less to build. The drivers benefit from cheaper parking fees and they save time.

(Source: adapted from http://japantravelmate (opens in a new tab).com/cool-japan/things-see-japans-automated-rotary-parking-systems)

Figure 4

With reference to the data above and your knowledge of economics, assess the extent to which changes in technology may reduce the shortage of car parking spaces in city centres.

332 marks

Figure 6 shows the quantity of a good supplied and demanded at different price levels.

price

Using the information in Figure 6, calculate the excess supply of goods in the market at a price of $50. You are advised to show your working.

34a1 mark

Define the term substitute good.

34b3 marks

Using the diagram below, draw the effects on the market for locally sourced goods of more customers preferring to buy from local firms. Label the new curve, new equilibrium price and new equilibrium quantity.

price
352 marks

Figure 4 shows the quantity of a good supplied and demanded at different price levels.

price

Using the information in Figure 4, calculate the excess demand of goods in the market at a price of $20. You are advised to show your working.