Representing Data Diagrammatically (AQA Level 3 Mathematical Studies (Core Maths): Paper 1: Data, Finance, Estimation & Modelling): Exam Questions

Exam code: 1350

2 hours15 questions
1a
4 marks
  • The World Health Organisation (WHO) collects data about life expectancy.

  • The WHO estimates the average life expectancy at birth for a person born in a particular country.

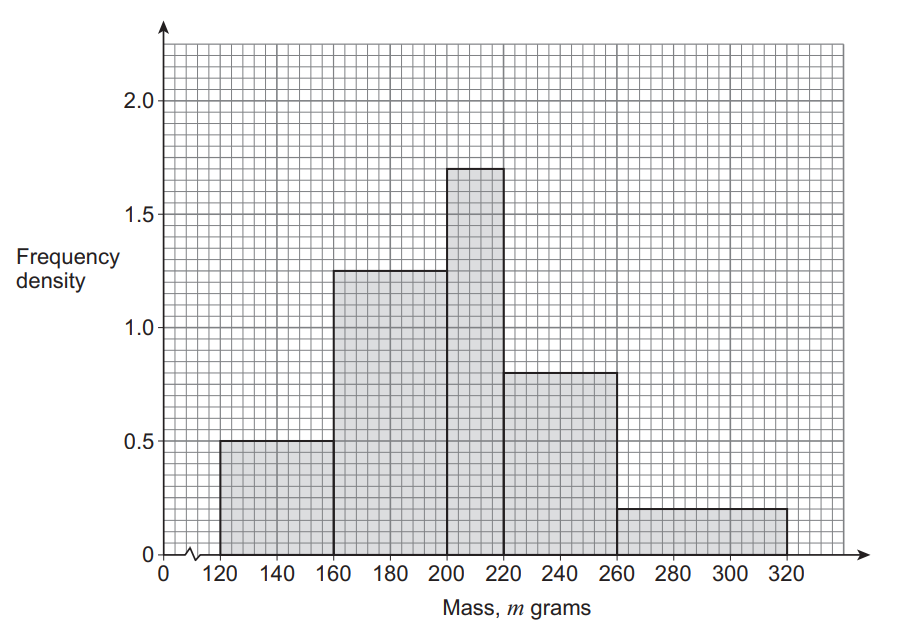
The data below are for 193 countries.

Life expectancy at birth (l years)

Number of countries

45 less-than or slanted equal to l less than 50

12

50 less-than or slanted equal to l less than 60

24

60 less-than or slanted equal to l less than 70

44

70 less-than or slanted equal to l less than 75

53

75 less-than or slanted equal to l less than 80

32

80 less-than or slanted equal to l less than 85

28

The life expectancy at birth for a person in the UK is 77 years. A newspaper headline said:

UK in top 40 countries for life expectancy

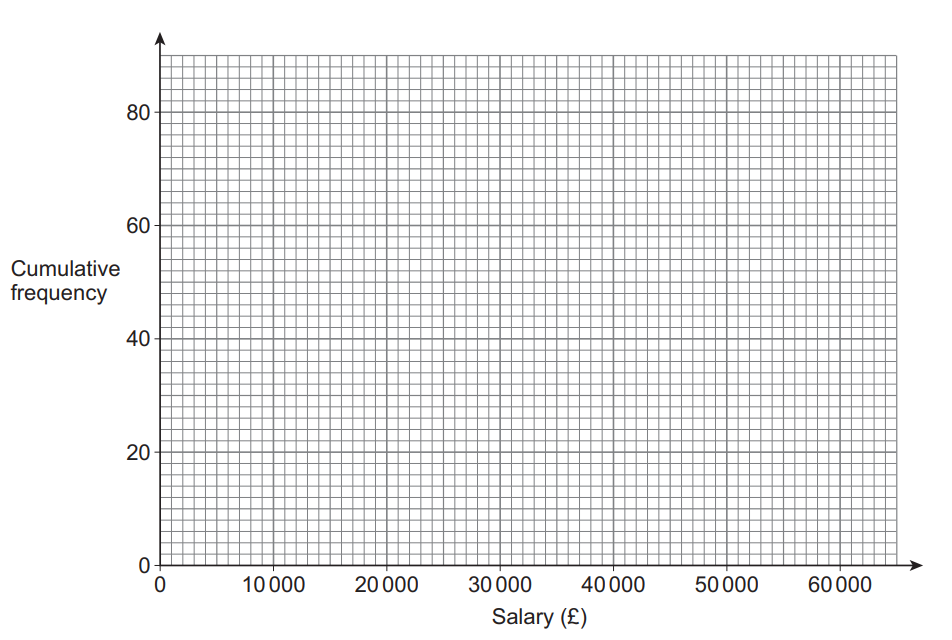
Use the given data to comment on the newspaper’s headline.

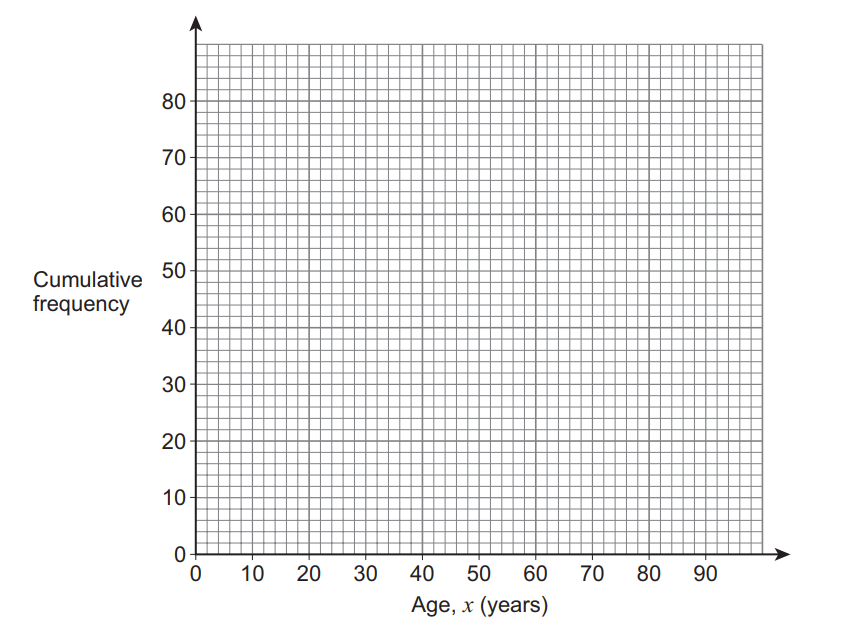
You may use the grid if you wish.

Square grid paper featuring evenly spaced, light blue horizontal and vertical lines forming small squares, suitable for drawing or plotting data.
1b
4 marks

For the whole world, the WHO gives the mean life expectancy at birth as 68.5 years.

The table below shows the life expectancy at birth sorted by world region and gender.

Life expectancy at birth

Region

Female

Male

Africa

61.0

57.9

Americas

77.7

71.9

Eastern Mediterranean

72.1

68.3

Europe

80.1

74.0

South-East Asia

72.2

68.2

Western Pacific

75.8

71.1

Compare the life expectancy by region and gender, commenting on any trends.

Compare the mean life expectancy given by WHO with the data in the table.

Consider whether region or gender has a greater effect on life expectancy.

1c
6 marks
  • The World Health Organisation (WHO) collects data about life expectancy.

  • The WHO estimates the average life expectancy at birth for a person born in a particular country.

Estimate how far a person is likely to walk in their lifetime.

Show details of your assumptions and calculations.

2
10 marks

The world’s biggest half-marathon, the Great North Run (GNR), is held annually.

The first race took place in 1981

The table below shows the times taken to complete the 2010 race by the 120 members of the ‘all GNR’ club. These are the runners who have taken part every year since the race began.

The fastest runner had a time of 89 minutes.
The slowest runner had a time of 268 minutes.

Length of time, t minutes

Number of runners

0 less or equal than t less than 80

0

80 less or equal than t less than 100

9

100 less or equal than t less than 120

35

120 less or equal than t less than 140

30

140 less or equal than t less than 160

18

160 less or equal than t less than 180

10

180 less or equal than t less than 200

8

200 less or equal than t less than 280

10

280 less or equal than t

0

The times of the ‘all-GNR’ club runners were also recorded in 2005

The data for 2005 is shown as a box and whisker diagram below.

Box plot labelled "2005" showing distribution of minutes. Median at 110, range from 60 to 250, with interquartile range from 80 to 125.

Compare the performance of the ‘all-GNR’ club runners in 2005 and 2010

You may use the grid below if you wish.

A sheet of square graph paper featuring a grid of small blue squares, intersected by darker bold lines every five squares, set against a white background.
3a
3 marks

The table shows information about the ages of 80 guests staying at a hotel in the UK

Age, x (years)

Frequency

10 < x ⩽ 30

8

30 < x ⩽ 50

34

50 < x ⩽ 70

32

70 < x ⩽ 90

6

On the grid, draw a cumulative frequency graph to show this information.

Grid graph with horizontal axis labelled "Age, x (years)" ranging from 0 to 90, and vertical axis labelled "Cumulative frequency" from 0 to 80.
3b
1 mark

Use your graph to estimate the median age of the guests at the hotel.

3c
3 marks

Estimate the percentage of guests at the hotel who are more than 55 years old.

4a
3 marks

The time in minutes that 140 patients waited at a NHS walk-in clinic was recorded.

Complete the histogram and frequency table to represent the data.

Bar chart showing frequency density against time in minutes. First bar covers 0-20 minutes at 0.8 density; second covers 30-50 at 2.8; third covers 50-70 at 2.4.

Time, t (minutes)

Frequency

0 < t ⩽ 30

30 < t ⩽ 40

28

40 < t ⩽ 60

60 < t ⩽ 80

24

80 < t ⩽ 120

16

4b
5 marks

This histogram shows the waiting times for 140 patients at the clinic after two additional members of staff were employed.

Histogram showing frequency density versus time in minutes. Bars at 0-20, 20-40, 40-60, 60-80, and 80-100, with heights 1, 4, 2, 1, 0.5 respectively.

The clinic has a target of a maximum waiting time of 75 minutes.

What impact has the additional staff had on the number of patients whose waiting time exceeded the target?

You should use this histogram and the data from Question (a).

Show working to support your answer.

5a
1 mark

Mr Berry wants his class to study some data on swimming times.

He collects data from the Internet about two swimming strokes, backstroke and breaststroke.

The table shows the fastest 19 times, in seconds, for the men’s 100m Backstroke at a major championship.

Swimmer

A

B

C

D

E

F

G

H

I

J

Time (s)

51.85

51.94

52.38

52.54

52.91

52.98

53.17

53.45

53.60

53.86

Swimmer

K

L

M

N

O

P

Q

R

S

Time (s)

53.93

54.51

54.91

54.95

55.00

55.16

55.17

55.19

55.38

Which two words describe the type of data he has collected?

Tick(✓) your answers.

  • qualitative

  • primary

  • quantitative

  • secondary

5b
3 marks

The table below shows information about the fastest 19 times for the men’s 100m Breaststroke in the same championship.

Lowest value

Lower quartile

Median

Upper quartile

Highest value

Breaststroke

49.45

50.12

51.76

52.32

53.44

Backstroke

51.85

55.38

Complete this table to show the information for the backstroke.

The lowest and highest values have been completed for you.

5c
3 marks

Draw box and whisker plots to represent the data for the backstroke and breaststroke times.

A blank graph grid with vertical and horizontal lines labelled with time in seconds from 49 to 55.5 on the x-axis; y-axis unlabelled.
5d
2 marks

Make two comparisons of the distribution of times for the swimming strokes.

You should make one comparison based on the averages and one comparison based on the spreads.

6a
3 marks

The members of a running club are divided into two teams for a race.

The table shows information about the times taken to complete the race by the 40 members of Team A.

Time, t mins

Frequency

10 ⩽ t < 12

8

12 ⩽ t < 14

17

14 ⩽ t < 20

12

20 ⩽ t < 24

3

Draw a histogram to represent the data for Team A.

Grid graph with x-axis labelled 'Time, t mins' from 0 to 24 and y-axis labelled 'Frequency density' from 0 to 10, with no data plotted.
6b
5 marks

This histogram shows information about the times for the 40 members of Team B.

Bar chart showing frequency density against time in minutes. Bars at 10-12, 12-14, 14-18, 18-22 mins with heights 2, 9, 3, 1 respectively.

The runners from each team who completed the race in 15 minutes or less qualified for a competition.

Use the graph and data to estimate which team had more members who qualified.

You must show your working.

7a
3 marks

15 students sat a Maths exam and an English exam.

Both exams were marked out of 30

The stem-and-leaf diagram shows their Maths marks.

Maths marks

Key 1 | 8 represents a mark of 18

0 | 5 7

1 | 1 3 9 9

2 | 1 2 4 7 7 8 9 9

3 | 0

The table shows information about their English marks.

Lowest value

Lower quartile

Median

Upper quartile

Highest value

English marks

3

17

19

26

28

Maths marks

Complete the table to show the information for the Maths exam.

7b
3 marks

Draw box and whisker plots to represent the data for the English and Maths exams.

Blank graph paper with horizontal axis labelled "Marks" ranging from 0 to 35. The chart features a grid of small squares.
7c
1 mark

Compare the average marks for the English and Maths exams.

7d
1 mark

Which marks were more consistent, English or Maths?

Give a reason for your answer.

8a
4 marks

Linda grows and sells potatoes.

The mean mass of her potatoes in last year’s crop was 193 grams.

She sees this advert for a new fertiliser for potatoes.

New potato fertiliser advertisement claiming to increase crop mass by at least 15%, featuring bold text and a starburst with "New!".

Linda uses the fertiliser on her next crop of potatoes.

The table shows the mass of these 130 potatoes when she picks them.

Mass, m grams

Number of potatoes

120 space less or equal than m less than 160

12

160 space less or equal than m less than 200

23

200 space less or equal than m less than 240

45

240 space less or equal than m less than 280

32

280 space less or equal than m less than 320

18

Based on these two crops of potatoes, is the claim in the advert justified? You must show your working.

8b
4 marks

Dan also grows and sells potatoes.

The histogram shows the distribution of the masses of his potatoes this year.

Histogram of mass in grams showing frequency density. Bars range from 120 to 320 grams, peaking between 180 and 220 grams.

The potatoes are classed as small, medium and large.

Medium potatoes have a mass between 188 grams and 260 grams.

Estimate the number of Dan’s potatoes that are classed as medium.

9a
3 marks

The table shows information about the annual salaries of 80 people working in sales in the UK.

Salary
(£S)

Frequency

0 space less than space S space less or equal than space 10 space 000

9

10 space 000 space less than space S space less or equal than space 20 space 000

36

20 space 000 space less than space S space less or equal than space 30 space 000

21

30 space 000 space less than space S space less or equal than space 40 space 000

8

40 space 000 space less than space S space less or equal than space 50 space 000

4

50 space 000 space less than space S space less or equal than space 60 space 000

2

On the grid, draw a cumulative frequency graph to show this information.

Graph with x-axis labelled "Salary (£)" ranging from 0 to 60,000 and y-axis labelled "Cumulative frequency" ranging from 0 to 80, with grid lines.
9b
2 marks

Use your graph to estimate the value needed to complete the sentence below.

20% of these people earn less than £ __________________________

9c
2 marks

The average salary for all people working in sales in the UK is approximately £22 000

Estimate the percentage of these 80 people who earn more than the average salary.

_________%

10
5 marks

Two groups of students take part in a long jump competition.

The stem-and-leaf diagram shows the distances jumped by group A.

Key 5 | 1 represents 5.1 metres

2 | 1 7 8

3 | 0 2 5 6

4 | 2 5 7 8 9

5 | 1 3 4

Here is some information about the distances jumped by group B.

Median

3.9

Interquartile range (IQR)

1.7

Compare the performances of the two groups.

You must show your working.

11a
4 marks

The histogram shows some information about the lengths,l cm, of fish sold in a month by a garden centre.

Histogram showing fish frequency density by length in centimetres, with two bars: 0-6cm and 6-10cm. Key indicates each square equals 20 fish.

Work out an estimate of the number of fish with lengths in the interval 4.5 less than l less or equal than 10

11b
2 marks

The garden centre sold 96 fish with lengths in the interval 10 less than l less or equal than 14

Add this information to the histogram.

12a
4 marks

A report has claimed that, due to streaming, modern technology is responsible for reducing the length of song introductions (intros).

Steven collected data from two different time periods, 1970 to 2000 and 2010 to 2018, to test this claim.

Length of intro in seconds

1970 to 2000

2010 to 2018

120

20

78

10

65

14

65

18

52

9

32

22

50

23

20

12

68

6

41

14

39

19

56

15

72

10

59

15

61

16

87

23

48

15

62

21

27

28

Complete the table below to show the summary statistics for 1970 to 2000

Lowest value

Lower quartile

Median

Upper quartile

Highest value

1970 to 2000

2010 to 2018

6

12

15

21

28

12b
3 marks

Draw box and whisker plots on the grid below to represent the two sets of data.

Graph with a labelled x-axis showing "Length of intro in seconds" from 0 to 120, y-axis unlabelled, and a grid background; no data points.
12c
2 marks

Make two comparisons of the lengths of song intros from the two sets of data.

13a
2 marks

There are 120 applicants for a new television show.

The table shows information about their ages.

Age, x (years)

Frequency

18 less than x less or equal than 25

14

25 less than x less or equal than 40

36

40 less than x less or equal than 50

48

50 less than x less or equal than 70

22

Draw a histogram to represent this information.

Graph with "Age in years" on the x-axis and "Frequency density" on the y-axis, both labelled. Grid background, no data plotted.
13b
4 marks

The 120 applicants were all given a task to complete.

The histogram represents the times they took to complete the task.

Graph showing frequency density against time in minutes. Bars at 10-15, 15-25, 25-35, and 35-40 minutes vary in height, indicating data distribution.

Those applicants who completed the task in 18 minutes or less were selected for the show.

Estimate the number of applicants who were selected for the show.

13c
2 marks

The television manager wants to interview some of the applicants about their experience of doing the task.

Here is some more information about the applicants.

Age, x (years)

bold 18 bold less or equal than bold italic x bold less than bold 25

bold 25 bold less or equal than bold italic x bold less than bold 40

bold 40 bold less or equal than bold italic x bold less than bold 50

bold 50 bold less or equal than bold italic x bold less than bold 70

Male

5

19

12

8

Female

9

17

36

14

The manager wants a sample of 50 applicants, stratified by age group and gender.

How many females from the age group 40 less or equal than x less than 50 should he select?

14a
1 mark

The boys from class 10A did a cross-country run.

Here are their times in minutes.

24.6

22.3

29.2

36.4

31.3

35.0

25.4

34.5

42.0

39.6

19.5

What was the median time in minutes?

  • 22.5

  • 30.9

  • 31.3

  • 35.0

14b
2 marks

Work out the interquartile range of the times for the boys from class 10A.

14c
4 marks

The rest of the year 10 boys in the school also did the cross-country run.

The box and whisker diagram shows the distribution of their times.

Box plot showing data range from 17 to 41 minutes, with quartiles at 20, 31, and 36 minutes. Grid background with horizontal time axis.

Compare the performance of the boys in class 10A with the rest of the year 10 boys.

15a
3 marks

Ravi is a gardener who grows and sells sunflowers.

This year he bought two different types of sunflower seeds, Type A and Type B.

He planted 60 seeds of Type A.

The table shows the maximum height each of these 60 sunflowers grew to.

Maximum height of Type A sunflowers

Height, h, cm

Frequency

150 less or equal than h less than 250

10

250 less or equal than h less than 300

15

300 less or equal than h less than 325

18

325 less or equal than h less than 350

15

350 less or equal than h less than 400

2

Draw a histogram to represent this information.

Grid graph showing frequency density on the vertical axis ranging from 0 to 0.8, and height in centimetres on the horizontal axis from 0 to 400.
15b
5 marks

Ravi also planted 80 seeds of Type B sunflowers.

This histogram shows the distribution of the maximum heights these 80 sunflowers grew to.

Histogram showing frequency density of height in cm with bars ranging from 275-300, 300-325, 325-350, with varying heights, and a drop after 350.

A florist pays Ravi more money for sunflowers that are at least 340 cm tall.

Which type of sunflower, A or B, had the greater proportion of sunflowers that were at least 340 cm tall?

You must show your working.