Marks and Spencer plc is one of the UK’s leading retailers. It provides its own-brand food, clothing and home products in 1433 stores worldwide and online.
Appendix A Extracts from Marks and Spencer plc’s published financial accounts
Balance sheet as at 1 April 2017
| £ million |
Assets | |
Non-current assets | 6 569 |
Current assets | 1 723 |
Liabilities | |
Current liabilities | 2 368 |
Non-current liabilities | 2 774 |
Net assets | 3 150 |
Equity | |
Total equity | 3 150 |
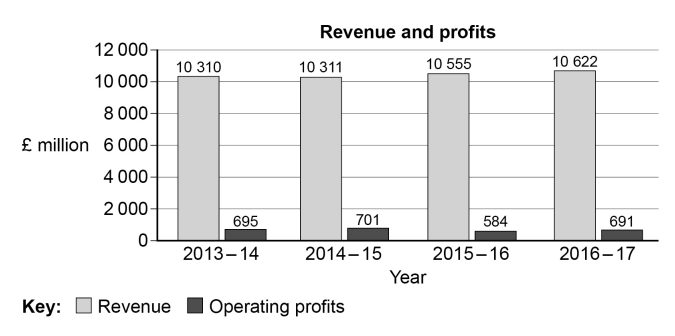
Appendix B Marks and Spencer plc’s revenue and operating profit 2013–14 to 2016–17
Appendix C Marks and Spencer plc customer data for financial year ending 1 April 2017
| Total number of customers | Percentage change on previous year | Average number of times a year a customer buys from Marks & Spencer | Percentage change on previous year |
Food | 20.5 million | +2.0% | 22.5 | 0% |
Clothing and home | 24.6 million | 0% | 7.2 | –5.3% |
Appendix D Marks and Spencer plc online data
| 2016–17 | Percentage change on previous year |
Total online revenue | £836.3 million | +5.6% |
Weekly site visits | 8.3 million | +11% |
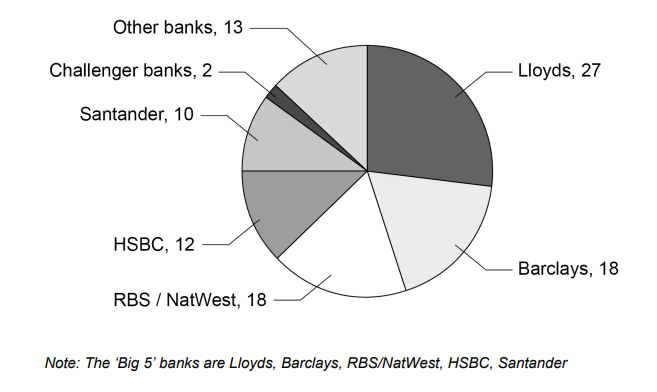
Appendix E Information on Marks and Spencer plc’s Board of Directors in 2017
International experience: directors come from the following countries
China | Germany | Hong Kong | India | Japan | Italy |
UK | Spain | Netherlands | Poland | South Africa | USA |
Gender diversity: 70% of directors are male, 30% female
Industry sector experience of directors: retail 90%, consumer 100%, finance 60%, e-commerce and technology 40%
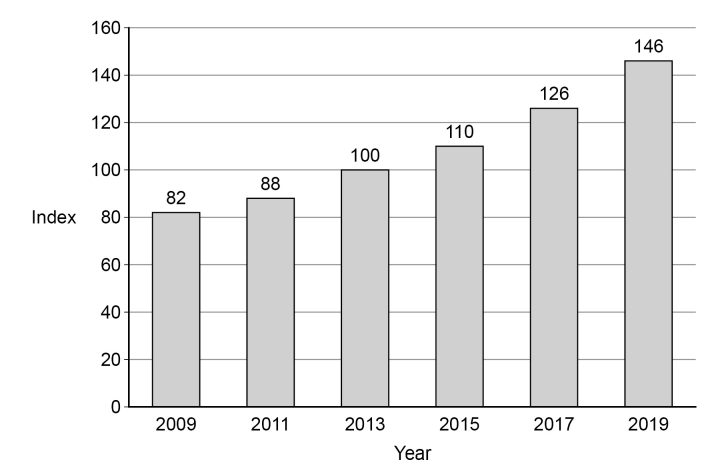
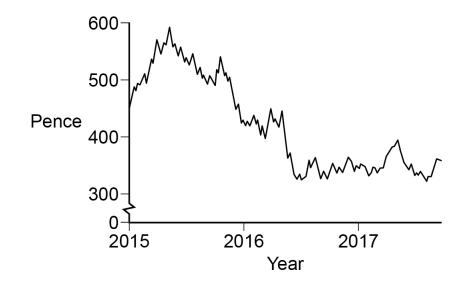
Appendix F Marks and Spencer plc’s share price