Marketing Objectives (AQA A Level Business): Exam Questions

Exam code: 7132

23 mins5 questions
1
12 marks

Read the case study in the Insert (opens in a new tab).

Sanjay has a marketing objective of achieving a 15% market share within 3 years.

Analyse the factors that influenced Sanjay’s decision to set his marketing objective at a 15% market share.

2
1 mark

A product’s price rises by 20% and its sales volume falls by 10%. All of its competitors leave their prices unchanged. The product’s market share, as measured by sales volume, remains the same.

Which of these statements is false?

  • The market size, measured by volume, remains unchanged.

  • The product’s market share, measured by value, increases.

  • The product’s price elasticity of demand is inelastic.

  • The product’s sales value rises.

3
3 marks

Case Study

The UK tea market

Tea drinking in the UK is declining as younger customers choose alternatives such as coffee. Extrapolation of the annual sales suggests that coffee will outsell tea in the UK by 2025.

Within the overall tea market traditional black tea still dominates sales. However, a ‘health tea’ niche made up of fruit, herbal and green teas is growing. This niche has benefitted from its association with wellbeing.

Appendix A Annual sales volume of black tea and coffee (million kg), UK (actual sales 2012–2020; estimated sales 2021–2025)

Line graph comparing tea and coffee consumption from 2012 to 2025; tea decreases while coffee rises, intersecting in 2024. Tea is solid, coffee is dashed.

Appendix B UK tea brands 2019

Rank

Brand

Annual Sales (£m)

% change

Type of tea in range

1

Twinings

108

+3.8

Black and health tea

2

PG Tips

99

−7.2

Mainly black, with small new health tea range

3

Taylors (including Yorkshire Tea)

98

+5.0

Black and health tea

4

Tetley

90

+0.4

Mainly black but some health tea

5

Pukka

23

+15.4

Organic and ethical black and health teas

Other tea brands

144

Appendix C Price elasticity of demand data

Type of tea

Price elasticity of demand

Black tea

−1.2

Health teas

−0.5

Appendix D Selected data from recent market research survey

How often do you drink black tea? (% of respondents)

Overall

Age 18–24

Age over 65

Several times a day

42

25

56

Once a day

15

16

16

2–3 times per week

10

14

5

Occasionally

12

17

7

Never

21

28

16

Do you drink health tea? (% of respondents)

Yes

Female

32

Male

19

How important is it that the tea you buy is ethically sourced, eg fair trade? (% of respondents)

Important

62

Not very important

26

Not at all important

12

Using Appendix B, calculate the combined market share of the top four tea brands in 2019.

4
4 marks

In 2007, a business had sales of £10 million in a market with a size of £125 million.
In 2017 the business’s sales were £12.6 million and its market share was 6%.

Calculate the percentage growth in the size of the market between 2007 and 2017.

5
3 marks

Case Study

The rise of the discount food retailers

For many years four companies have dominated food retailing sales in the UK: Asda, Morrisons, Sainsbury’s and Tesco. However, these ‘big four’ retailers have faced growing competition from discount retailers such as Aldi and Lidl.

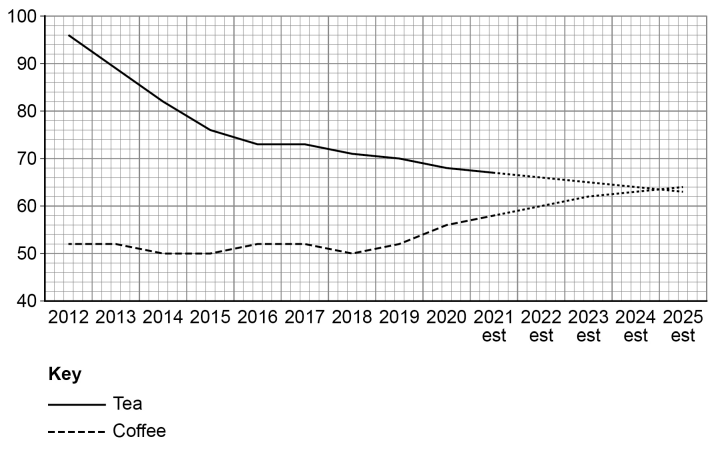
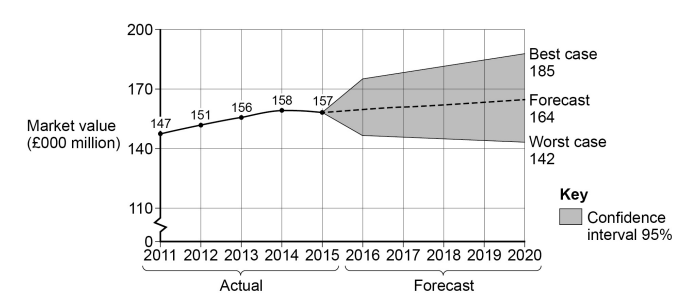
Figure 1: Total UK food retail sales

Line graph of market value (£000 million) from 2011 to 2020, with data shown for 2011-2015 and forecast for 2016-2020. Shaded area indicates 95% confidence interval.

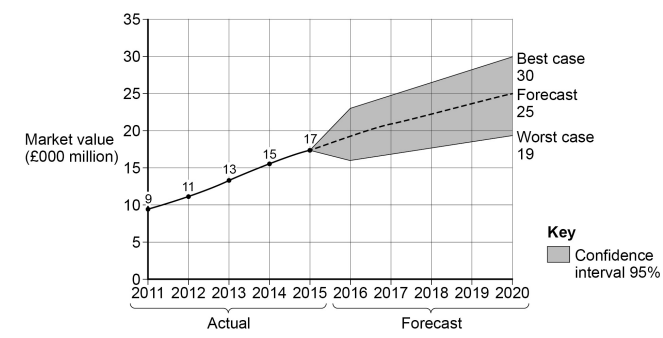
Figure 2: UK food retail sales of discount food retailers

Line graph of market value (£000 million) from 2011 to 2020, showing actual values from 2011 to 2015 and forecast with 95% confidence interval for 2016-2020.

Figure 3: A comparison of the ‘big four’ model with the discounter model

The typical discounter model
eg Aldi, Lidl

‘big four’ model
eg Tesco, Sainsbury’s

Product range in stores

Relatively small
eg 800 items

Large
eg 50 000 items

Brands

Large proportion of own label products traditionally targeting low to medium income earners

Large proportion of well-known brands traditionally targeting high to medium income earners

Sales of food compared to non-food items (eg clothing and health and beauty products)

80%:20%

60%:40%

Administration costs and overheads as percentage of turnover

15%

20%

Typical profit margin

3%

2%

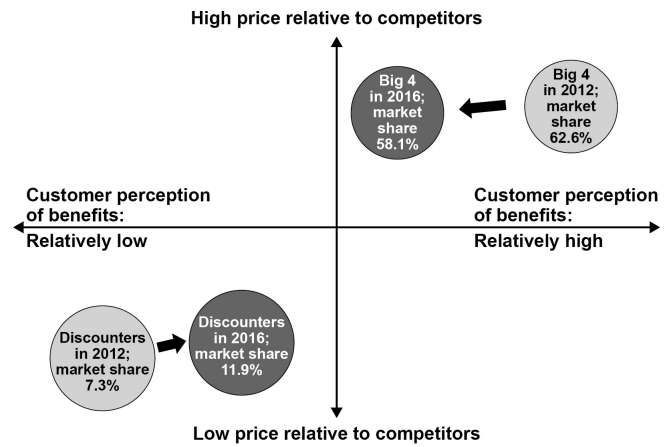
Figure 4: Market map of the UK food retail sector

Graph with axes: price and customer benefit perception. Big 4: higher price, benefit; 2012 market share 62.6%, 2016 58.1%. Discounters: lower price, benefit; 2012 7.3%, 2016 11.9%.

Figure 5: Extract from consumer survey:

“What benefit is most important in determining where you shop?”

Benefit

% of replies

I can rely on what I need being in stock

16

It has a good range of non-food products

17

It has well trained, helpful staff readily available

18

The stores are well designed and maintained

14

Figure 6: Company and Human Resource Data

Aldi Stores Ltd (discount retailer) 2014

Tesco (one of the ‘big four’) 2014

Turnover

£6 893 million

£ 54 443 million

Profit for the year

£250 million

£162 million

Average salary per employee

£21 272

£14 452

Total employee costs

£507 million

£6 968 million

Number of employees

23 858

482 152

Calculate the market share of the discount retailers in the UK food retail market in 2015.