1
1 mark
The diagram below shows ‘the experience curve’ of a particular business.
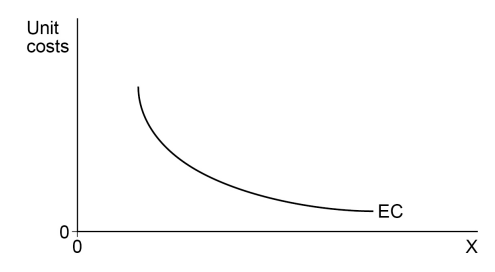
The x-axis for this diagram measures:
annual output.
capacity utilisation (%).
cumulative output.
employee numbers.
Was this exam question helpful?
Exam code: 7132
The diagram below shows ‘the experience curve’ of a particular business.
The x-axis for this diagram measures:
annual output.
capacity utilisation (%).
cumulative output.
employee numbers.
Was this exam question helpful?
The data in the table refers to a company’s production of a product.
Between 2020 and 2021 there was a decrease in the unit costs of the product.
2020 | 2021 | |
Capacity | 80 | 125 |
Actual output | 80 | 100 |
Statement 1: ‘Between 2020 and 2021, economies of scale might have led to lower unit costs.’
Statement 2: ‘Between 2020 and 2021, higher capacity utilisation might have led to lower unit costs.’
Read statements 1 and 2 and select the correct option from the following:
Statement 1 is true. Statement 2 is true.
Statement 1 is true. Statement 2 is false.
Statement 1 is false. Statement 2 is true.
Statement 1 is false. Statement 2 is false.
Was this exam question helpful?
Biggs Ltd
Biggs Ltd operates in the snack food market, selling crisps, nuts and other savoury products. Potatoes are a key ingredient in its snacks. The price of potatoes has risen by 35% over the last two years.
The company is one of six firms who dominate a market that has been growing strongly for ten years. The market growth is largely due to the development of new snacks designed for children. However, Biggs Ltd’s market share has been falling since 2019.
Biggs Ltd plans to launch a completely new range of products in 2024. It will promote this by sponsoring a major televised sporting competition which has children and families as its audience.
Appendix A Extract from Biggs Ltd’s recent financial statements
2023 | 2022 | |
Revenue | 47 569 | 46 994 |
Gross profit | 22 289 | 22 820 |
Operating profit | 4 650 | 4 701 |
Payables | 5 056 | 5 221 |
Appendix B Labour productivity for Biggs Ltd and the snack food industry average (shown as an index number, base year = 2017)
Year | Biggs Ltd | Industry average |
2020 | 104.2 | 104.3 |
2023 | 100.3 | 105.9 |
Appendix C Marketing expenditure as a percentage of revenue, 2020–2024*
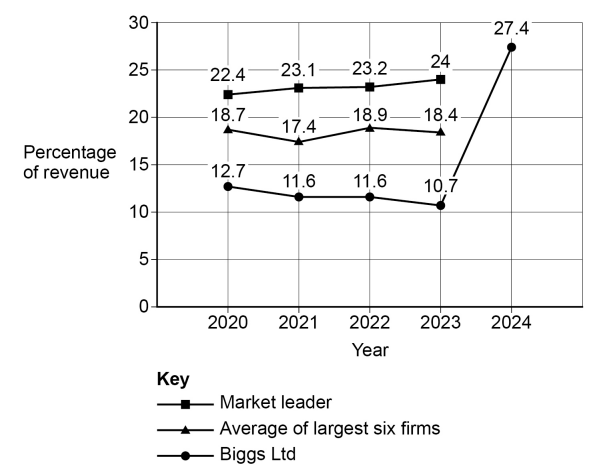
* 2024 based on Biggs Ltd’s forecast.
Appendix D Results of market research conducted with families on Biggs Ltd’s new product range and the promotional campaign
Survey question | Average survey score by age group | ||
6 to 16 years | 17 to 35 years | 36 years and over | |
I will definitely try the new products when they are available. | 9.9 | 7.2 | 1.8 |
The promotional campaign improves my view of Biggs Ltd’s brand. | 8.3 | 6.3 | 8.0 |
I frequently consume snack foods at sports events. | 8.9 | 6.9 | 2.7 |
Scale: 10 = strongly agree, 5 = neither agree nor disagree, 0 = strongly disagree | |||
Source: Data from 27 interviews with families, conducted by Biggs Ltd in 2021.
Appendix E Percentage of snack products bought and consumed by different box age groups
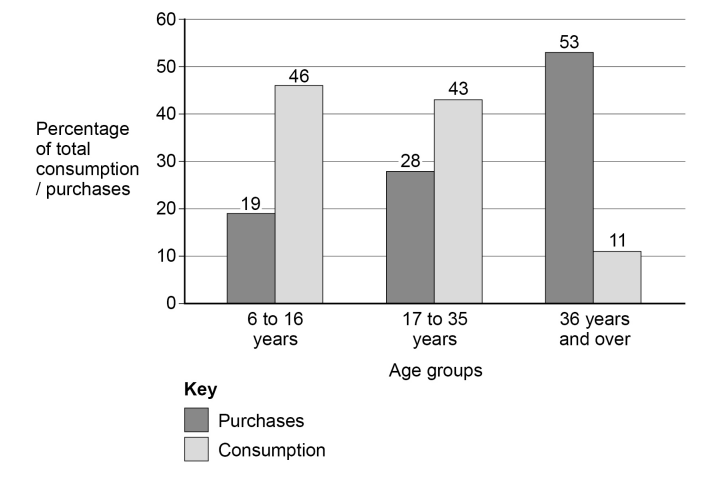
Results from a recent survey of 3000 respondents conducted by an independent market research firm.
Analyse how the changes in Biggs Ltd’s labour productivity, shown in Appendix B, may cause its market share to fall.
Was this exam question helpful?
Read the case study in the Insert (opens in a new tab).
Analyse how Speed-e-Puds Ltd benefits from operating with a high level of capacity utilisation.
Was this exam question helpful?
Which of the following will cause spare capacity in a business to rise?
New competitors are entering the market.
The business closes some factories.
The business closes some factories.
There is a successful advertising campaign.
Was this exam question helpful?
Read the case study in the Insert (opens in a new tab).
To what extent does the data in Appendix A suggest that building the new production facility will improve Logger Boards Ltd’s operational efficiency?
Was this exam question helpful?
Assuming no other changes, capacity utilisation is likely to be:
decreased by dynamic pricing and decreased by penetration pricing.
decreased by dynamic pricing and increased by penetration pricing.
increased by dynamic pricing and decreased by penetration pricing.
increased by dynamic pricing and increased by penetration pricing.
Was this exam question helpful?
Statement 1: ‘An increase in its level of capacity utilisation can help a business because it allows it more time for maintenance and repair of equipment.’
Statement 2: ‘An increase in its level of capacity utilisation can help a business because it allows it to meet unexpected increases in demand.’
Read statements 1 and 2 and select the correct option from the following options.
Statement 1 is true. Statement 2 is true.
Statement 1 is true. Statement 2 is false.
Statement 1 is false. Statement 2 is true.
Statement 1 is false. Statement 2 is false.
Was this exam question helpful?
The data below shows the weekly output and costs of a single-product firm.
Total costs = £80 000
Profit = £20 000
Labour costs = 42% of turnover
Labour costs per unit = 84 pence
Labour productivity = 25 units per employee
Calculate the weekly output of the firm in units.
Was this exam question helpful?
A business experiencing a lower level of capacity utilisation than usual may benefit because it
reduces the average costs of production.
provides more time for maintenance and repair of machinery.
can increase employee morale, because employees feel more secure in their jobs.
represents a more efficient use of capital equipment.
Was this exam question helpful?
Daihatsu
Daihatsu is a Japanese manufacturer of small cars. Its customers are now able to customise their vehicles with car panels that they design for themselves online. Until recently customising cars was expensive because it required skilled craftsmen to produce individual parts.
With 3-D printing, panels can be produced quickly and cheaply. Customers ordering a Daihatsu car from their local dealership can design their own panels for the sides of the car to create exactly the look that they want. Offering more customisation is one way that car manufacturers are trying to gain a competitive advantage in a fiercely competitive environment.
Cars are a high value item for consumers and are usually bought on credit; the finance to buy the car is often provided by the manufacturer. In 2016 over 74 million cars were sold worldwide. This represents a global capacity utilisation in the car industry of only 78%. Some commentators predict global capacity utilisation in the industry will fall in the next few years and that many car manufacturers will respond to this situation by price cutting.
Many car manufacturers are expected to respond to a fall in overall capacity utilisation in the industry by cutting prices.
To what extent is cutting prices a good way for any business to respond to a fall in the overall capacity utilisation in its industry?
Was this exam question helpful?