Inventory and Supply Chain Management (AQA A Level Business): Exam Questions

Exam code: 7132

1 hour12 questions
1
4 marks

Based on Figure 3, which shows the level of inventory for a product held in a supermarket until the end of day 4.

Graph labelled Figure 3 showing inventory levels over six days with a downward trend. Starts at 160 units and ends around 80 units.

The reorder quantity arriving at the end of day 4 is half the level of the reorder quantity that arrived at the end of day 2.

After the end of day 4 to the end of day 6 demand will fall to 30 units per day.

Show these two changes on Figure 3 by drawing in the lines that show inventory levels from the end of day 4 to the end of day 6.

2
2 marks

Case Study

Disrupted supply

DT is a UK-based business manufacturing circuit boards which it sells to other businesses. All of DT’s output is exported to Europe. The components that DT uses are sourced in the UK.

The supplier of a vital component closed suddenly in early 2020 disrupting DT’s supply chain. DT’s usual pattern of inventory control for this component is shown in Figure 1.

DT was forced to buy this component from a new and more expensive supplier.

DT stated: ‘We had no contingency plan. It was impossible for us to find alternative supplies quickly enough to fulfil all our existing orders. The new supplies had higher levels of defects.’

Line graph of inventory levels over 50 days, showing regular peaks and drops from 6000 units to near zero, with marked reorder and buffer levels.

With reference to Figure 1, calculate the lead time.

3
2 marks

Case Study

Disrupted supply

DT is a UK-based business manufacturing circuit boards which it sells to other businesses. All of DT’s output is exported to Europe. The components that DT uses are sourced in the UK.

The supplier of a vital component closed suddenly in early 2020 disrupting DT’s supply chain. DT’s usual pattern of inventory control for this component is shown in Figure 1.

DT was forced to buy this component from a new and more expensive supplier.

DT stated: ‘We had no contingency plan. It was impossible for us to find alternative supplies quickly enough to fulfil all our existing orders. The new supplies had higher levels of defects.’

Inventory control chart showing DT's typical pattern before disruption, with inventory levels fluctuating between maximum and reorder points over 50 days.

With reference to Figure 1, calculate the re-order quantity.

4
2 marks

Case Study

Disrupted supply

DT is a UK-based business manufacturing circuit boards which it sells to other businesses. All of DT’s output is exported to Europe. The components that DT uses are sourced in the UK.

The supplier of a vital component closed suddenly in early 2020 disrupting DT’s supply chain. DT’s usual pattern of inventory control for this component is shown in Figure 1.

DT was forced to buy this component from a new and more expensive supplier.

DT stated: ‘We had no contingency plan. It was impossible for us to find alternative supplies quickly enough to fulfil all our existing orders. The new supplies had higher levels of defects.’

Line graph showing inventory levels fluctuating between 0 and 6000 units over 50 days, with marked maximum, reorder, and buffer inventory levels.

With reference to Figure 1, calculate how much inventory DT uses each day.

5
16 marks

Case Study

Disrupted supply

DT is a UK-based business manufacturing circuit boards which it sells to other businesses. All of DT’s output is exported to Europe. The components that DT uses are sourced in the UK.

The supplier of a vital component closed suddenly in early 2020 disrupting DT’s supply chain. DT’s usual pattern of inventory control for this component is shown in Figure 1.

DT was forced to buy this component from a new and more expensive supplier.

DT stated: ‘We had no contingency plan. It was impossible for us to find alternative supplies quickly enough to fulfil all our existing orders. The new supplies had higher levels of defects.’

Reliability is the most important factor in a business’ choice of supplier. To what extent is this true for all businesses?

6
1 mark

In which of these situations is a business most likely to use outsourcing for some of its production?

Situation

Current level of capacity utilisation

Predictability of demand

A

High

High

B

High

Low

C

Low

High

D

Low

Low

  • Situation A

  • Situation B

  • Situation C

  • Situation D

7
9 marks

Case Study

Banking on change

The UK banking industry is dominated by the ‘Big 5’ banks. These banks have had costly networks of physical branches. Recently they have closed many branches, particularly in rural areas.

New technology and changes to government rules have opened the market to competition from relatively new entrants called ‘challengers’. Challenger banks target a niche and aim to provide better customer service.

Metro Bank, like other challengers, has grown fast, but unfortunately it had to declare losses after a major accounting error in early 2019.

Appendix A Examples of types of challenger bank

Bank(s)

Type of service

Monzo, Starling

Fully online bank (this type includes 90% of challengers)

Tesco, M&S

Bank linked to retailer brand

Metro Bank

City branches open 12 hours a day

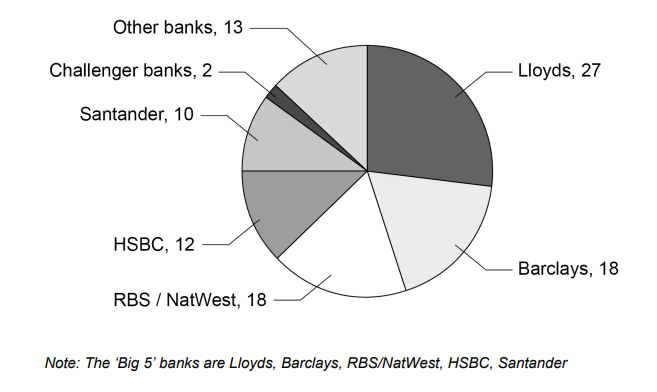
Appendix B Market share of banks in UK, 2019 (%)

Pie chart showing UK bank market share: Lloyds 27%, Barclays 18%, RBS/NatWest 18%, HSBC 12%, Santander 10%, Other banks 13%, Challenger banks 2%.

Appendix C Selected share price and market capitalisation box information

22 February 2019

6 March 2020

Metro Bank share price (pence)

1430.0

128.0

Metro Bank market capitalisation (£)

N/A

218.8m

Barclays Bank market capitalisation (£)

N/A

16 850m

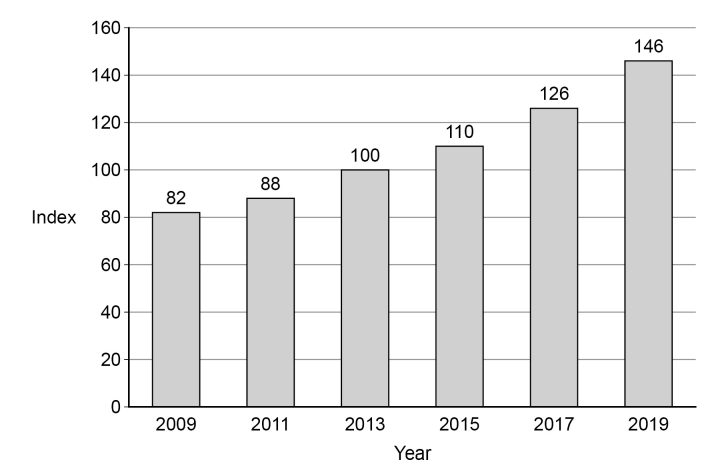
Appendix D People using online banking (2009–2019)
(Index: base year 2013)

Bar chart showing index increase from 82 in 2009 to 146 in 2019, with increments at 2011, 2013, 2015, and 2017.

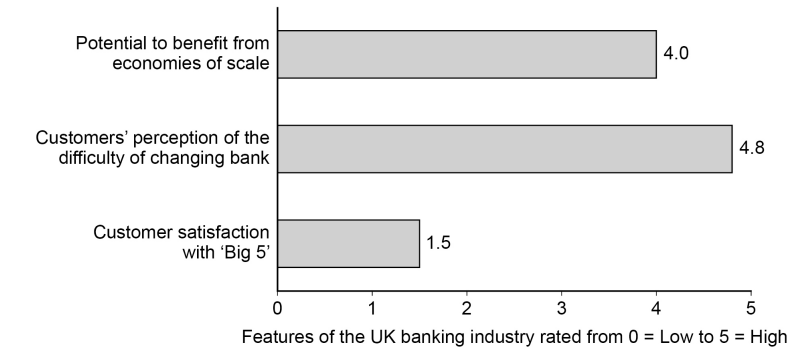
Appendix E Analysis of UK banking industry (2019)

Bar chart of UK banking features: economies of scale rated 4.0, difficulty changing bank 4.8, customer satisfaction with 'Big 5' 1.5, scale 0-5.

The closure of branches is seen as a way for the ‘Big 5’ banks to better match supply with demand.

Analyse how this action might affect the profits of these banks.

8
16 marks

Read the case study in the Insert (opens in a new tab).

To what extent is changing to cheaper suppliers a good decision for Sunport PLC?

9
1 mark

Figure 1 shows the inventory levels of a component held by a business over a period of nine days.

Line graph showing units decreasing over 10 days in three peaks. Each peak starts at 120 units, dropping sharply to near zero on days 3, 6, and 9.

The business has a reorder quantity of 90 units and a lead time for orders of 2 days. On which day was an incorrect quantity ordered?

  • Day 3.

  • Day 4.

  • Day 5.

  • Day 6.

10
1 mark

A factory has just experienced a zero level of inventory. It wishes to have a buffer level of inventory of 80 units. It uses 35 units per day and has a lead time of 5 days with its supplier.

Its re-order level is

  • 80 units.

  • 95 units.

  • 175 units.

  • 255 units.

11
12 marks

Read the case study in the Insert.

Analyse the value of effective inventory control to Hopps Clothing Ltd.

12
6 marks

Case Study

Daihatsu

Daihatsu is a Japanese manufacturer of small cars. Its customers are now able to customise their vehicles with car panels that they design for themselves online. Until recently customising cars was expensive because it required skilled craftsmen to produce individual parts.

With 3-D printing, panels can be produced quickly and cheaply. Customers ordering a Daihatsu car from their local dealership can design their own panels for the sides of the car to create exactly the look that they want. Offering more customisation is one way that car manufacturers are trying to gain a competitive advantage in a fiercely competitive environment.

Cars are a high value item for consumers and are usually bought on credit; the finance to buy the car is often provided by the manufacturer. In 2016 over 74 million cars were sold worldwide. This represents a global capacity utilisation in the car industry of only 78%. Some commentators predict global capacity utilisation in the industry will fall in the next few years and that many car manufacturers will respond to this situation by price cutting.

Explain how mass customisation benefits the shareholders of car manufacturers.