Human Resource Performance (AQA A Level Business): Exam Questions

Exam code: 7132

1 hour11 questions
1
1 mark

Based on the following data, which relates to business X.

Year

2020

2021

Revenue

£1 000 000

£1 000 000

Average price per unit

£5

£5

Units of output

200 000

200 000

Number of employees

20

22

Number of leavers

6

6

Total employee costs

£500 000

£550 000

Which one of the following outcomes happened between 2020 and 2021 for business X?

Labour productivity

Labour turnover

A

Decreased

Decreased

B

Decreased

Increased

C

Increased

Decreased

D

Increased

Increased

    2
    1 mark

    Based on the following data, which relates to business X.

    Year

    2020

    2021

    Revenue

    £1 000 000

    £1 000 000

    Average price per unit

    £5

    £5

    Units of output

    200 000

    200 000

    Number of employees

    20

    22

    Number of leavers

    6

    6

    Total employee costs

    £500 000

    £550 000

    Which one of the following outcomes happened between 2020 and 2021 for business X?

    Employee costs per unit

    Employee costs as a percentage of turnover

    A

    Decreased

    Decreased

    B

    Decreased

    Increased

    C

    Increased

    Decreased

    D

    Increased

    Increased

      3
      1 mark

      Stated below are three possible changes for a business.

      1. A reduction in wage levels.

      2. An increase in labour productivity.

      3. An increase in labour turnover.

      Other things being equal, which of the following changes is the most likely to lead to an increase in employee costs as a percentage of turnover?

      • 1 and 2 only

      • 2 and 3 only

      • 2 only

      • 3 only

      4
      2 marks

      Case Study

      Chillax Ltd

      Chillax Ltd runs six luxury health spas in southern England. Health spas offer health and beauty treatments such as steam baths, exercise and massage. Chillax Ltd’s customers expect high levels of service.

      The business focuses on quality. It emphasises the importance of getting the customer experience right. It feels this is more about how employees interact with customers than the facilities in each health spa. The quality of customer experience is monitored through frequent customer surveys using the Chillax App. The business regularly has positive reviews online.

      Chillax Ltd invests heavily in training, consults regularly and provides frequent feedback to staff. It feels that its high level of employee engagement has many benefits and ultimately ensures happy customers.

      Chillax Ltd is unusual in the Health and Beauty sector in that many businesses in that sector have very high rates of labour turnover averaging over 30%.

      Table 2 Selected employee data for Chillax Ltd for 2020 (31 December 2020)

      Number of employees on 1 January 2020

      180

      Employees leaving during the year

      24

      Employees staying all year

      162

      Using Table 2 calculate the employee retention rate for Chillax Ltd in 2020.

      5
      16 marks

      Case Study

      Chillax Ltd

      Chillax Ltd runs six luxury health spas in southern England. Health spas offer health and beauty treatments such as steam baths, exercise and massage. Chillax Ltd’s customers expect high levels of service.

      The business focuses on quality. It emphasises the importance of getting the customer experience right. It feels this is more about how employees interact with customers than the facilities in each health spa. The quality of customer experience is monitored through frequent customer surveys using the Chillax App. The business regularly has positive reviews online.

      Chillax Ltd invests heavily in training, consults regularly and provides frequent feedback to staff. It feels that its high level of employee engagement has many benefits and ultimately ensures happy customers.

      Chillax Ltd is unusual in the Health and Beauty sector in that many businesses in that sector have very high rates of labour turnover averaging over 30%.

      Table 2 Selected employee data for Chillax Ltd for 2020 (31 December 2020)

      Number of employees on 1 January 2020

      180

      Employees leaving during the year

      24

      Employees staying all year

      162

      To what extent should all businesses be concerned if they have high rates of labour turnover?

      6
      4 marks

      The data below relates to a factory.

      • Capacity = 180 units per day

      • Number of employees = 16

      • Wages per day = £60 per employee

      • Selling price of product = £15 per unit

      • Capacity utilisation of factory = 80%

      Assuming that all output is sold, calculate the factory’s employee costs as a percentage of turnover.

      7
      9 marks

      Case Study

      Drake Hotels PLC owns 20 budget hotels in the UK. Each one is located in a different city. The industry is very competitive and Drake’s managers all have an objective to help the business to be as efficient as possible.

      Drake Hotels PLC’s operating profit for the financial year 2019–20 was £18 million. Last month the company appointed a new Chief Executive, Mary Myers, to increase the profitability of the business. Mary was previously the Marketing Manager of an upmarket hotel chain.

      Mary is already considering an investment proposal for a luxury hotel in Oxford. This hotel would target overseas visitors who might want to visit the city. Drake Hotels has found a suitable building but needs to invest to develop it.

      Appendix A Investment appraisal results for the proposed investment into a new hotel in Oxford (based on net inflows for first eight years).

      Average rate of return 12% per year
      Net Present Value £25 million

      Source: Chief Executive

      Appendix B Sensitivity analysis for the new Oxford hotel investment proposal

      Two possible changes in the economy that might affect the investment appraisal results in Appendix A

      Estimated probability of this change happening

      The value of the pound against other currencies is 10% higher than originally forecasted.

      20%

      The average GDP growth in overseas countries is 1.5% higher than originally forecasted.

      30%

      Source: Chief Executive

      Appendix C Selected financial data for Drake Hotels PLC

      £ million as at 1 May 2020

      Current assets

      15

      Current liabilities

      18

      Total equity

      170

      Non-current liabilities

      280

      Appendix D Forecasted data for Drake Hotels PLC’s new Oxford hotel investment proposal

      Initial investment required £20 million
      Estimated income elasticity of demand +2
      Percentage of customers visiting from overseas 70%
      Estimated cost of borrowing for this investment 8% per annum

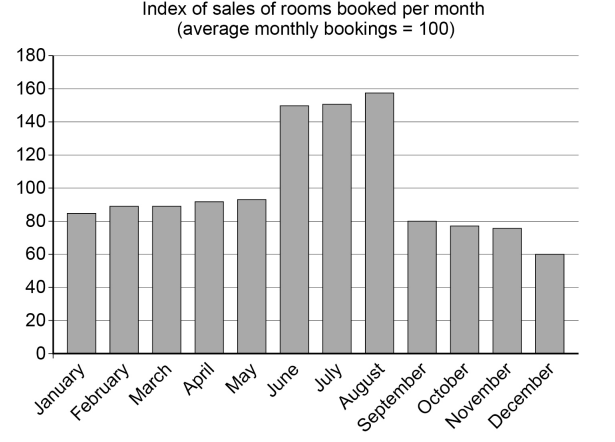
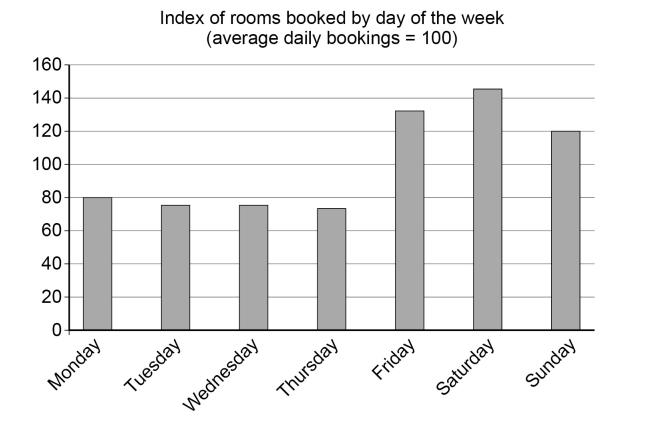
      Appendix E Room bookings by month and day of the week in Drake Hotels PLC’s budget hotels 2019

      Bar chart showing monthly room bookings index. Peaks in June to September at around 160. Lower in January to May, October to December, around 70-100.
      Bar chart of room bookings index by day: Low on weekdays, highest on Saturday, moderate on Sunday, with Friday above average. Average bookings index is 100.

      Analyse the challenges the Human Resource manager faces as a result of the patterns of room bookings in Appendix E.

      8
      1 mark

      The table below provides data on a business.

      2017

      2018

      Number of employees

      25

      20

      Labour turnover (%)

      20

      10

      Total units of output

      500

      420

      Statement 1: ‘This business had a higher labour retention rate in 2018 than 2017.’
      Statement 2: ‘This business had higher labour productivity in 2018 than 2017.’

      Read statements 1 and 2 and select the correct option from the following

      • Statement 1 is true. Statement 2 is true.

      • Statement 1 is true. Statement 2 is false.

      • Statement 1 is false. Statement 2 is true.

      • Statement 1 is false. Statement 2 is false.

      9
      16 marks

      Case Study

      Galin plc

      Galin is a large multinational company that sells products in 10 different categories, including fabric care (eg washing powder), home care (eg furniture polish) and hair care (eg shampoo) products. It has 50 different brands and in 2018 achieved global sales of $60 billion.

      Galin has chosen to have a regional organisational structure, dividing the world into six regions: North America, Europe, Asia, Latin America, the Middle East and Africa. There are major differences between these regions: for example, in terms of market conditions, labour markets and economic factors.

      In 2018 Galin invested 3% of its sales revenue into research and development (compared with an industry average of 1%) and owned 55 000 patents. Its new products achieve high profit margins. When developing products, Galin encourages collaboration between people in different jobs.

      An objective of the company for 2019 is to increase labour productivity.

      Galin wants to increase labour productivity.

      To what extent do you think that attempts by businesses to increase labour productivity will be welcomed by employees?

      10
      9 marks

      The table below shows the changes in the average annual labour turnover rates for BBB plc and its competitors.

      Time period

      Annual labour turnover (%)
      (average for BBB plc)

      Annual labour turnover (%)
      (average for competitors)

      1978–1987

      15

      15

      1988–1997

      12

      18

      1998–2007

      10

      18

      2008–2017

      8

      23

      Analyse how the changes in these data over time might have affected the ability of BBB plc to provide higher-quality products than its competitors.

      11
      9 marks

      Case Study

      The rise of the discount food retailers

      For many years four companies have dominated food retailing sales in the UK: Asda, Morrisons, Sainsbury’s and Tesco. However, these ‘big four’ retailers have faced growing competition from discount retailers such as Aldi and Lidl.

      Figure 1: Total UK food retail sales

      Line graph of market value (£000 million) from 2011 to 2020, with data shown for 2011-2015 and forecast for 2016-2020. Shaded area indicates 95% confidence interval.

      Figure 2: UK food retail sales of discount food retailers

      Line graph of market value (£000 million) from 2011 to 2020, showing actual values from 2011 to 2015 and forecast with 95% confidence interval for 2016-2020.

      Figure 3: A comparison of the ‘big four’ model with the discounter model

      The typical discounter model
      eg Aldi, Lidl

      ‘big four’ model
      eg Tesco, Sainsbury’s

      Product range in stores

      Relatively small
      eg 800 items

      Large
      eg 50 000 items

      Brands

      Large proportion of own label products traditionally targeting low to medium income earners

      Large proportion of well-known brands traditionally targeting high to medium income earners

      Sales of food compared to non-food items (eg clothing and health and beauty products)

      80%:20%

      60%:40%

      Administration costs and overheads as percentage of turnover

      15%

      20%

      Typical profit margin

      3%

      2%

      Figure 4: Market map of the UK food retail sector

      Graph with axes: price and customer benefit perception. Big 4: higher price, benefit; 2012 market share 62.6%, 2016 58.1%. Discounters: lower price, benefit; 2012 7.3%, 2016 11.9%.

      Figure 5: Extract from consumer survey:

      “What benefit is most important in determining where you shop?”

      Benefit

      % of replies

      I can rely on what I need being in stock

      16

      It has a good range of non-food products

      17

      It has well trained, helpful staff readily available

      18

      The stores are well designed and maintained

      14

      Figure 6: Company and Human Resource Data

      Aldi Stores Ltd (discount retailer) 2014

      Tesco (one of the ‘big four’) 2014

      Turnover

      £6 893 million

      £ 54 443 million

      Profit for the year

      £250 million

      £162 million

      Average salary per employee

      £21 272

      £14 452

      Total employee costs

      £507 million

      £6 968 million

      Number of employees

      23 858

      482 152

      The discount retailers are said to manage their human resources very effectively. Explain how the data in Figure 6 supports this view. Use calculations to support your answer.