Assessing the Internal Position of a Business (AQA A Level Business): Exam Questions

Exam code: 7132

3 hours26 questions
1
1 mark

A business’ current liabilities are three times the level of its current assets.

Shareholders provide 20% of its capital employed.

This business has:

  • a high current ratio and a high gearing.

  • a high current ratio and a low gearing.

  • a low current ratio and a high gearing.

  • a low current ratio and a low gearing.

2
25 marks

To what extent are financial ratios the best way of assessing the performance of non-profit organisations, such as charities or mutuals?

3
4 marks

p

4
4 marks

Case Study

Biggs Ltd

Biggs Ltd operates in the snack food market, selling crisps, nuts and other savoury products. Potatoes are a key ingredient in its snacks. The price of potatoes has risen by 35% over the last two years.

The company is one of six firms who dominate a market that has been growing strongly for ten years. The market growth is largely due to the development of new snacks designed for children. However, Biggs Ltd’s market share has been falling since 2019.

Biggs Ltd plans to launch a completely new range of products in 2024. It will promote this by sponsoring a major televised sporting competition which has children and families as its audience.

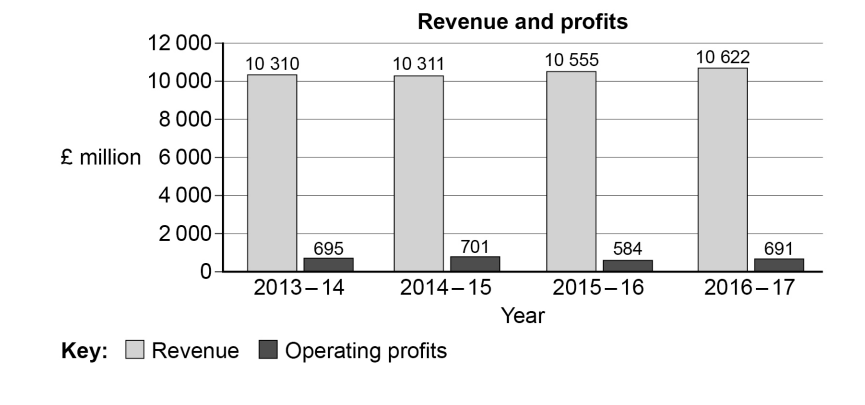
Appendix A Extract from Biggs Ltd’s recent financial statements

2023
£000s

2022
£000s

Revenue

47 569

46 994

Gross profit

22 289

22 820

Operating profit

4 650

4 701

Payables

5 056

5 221

Appendix B Labour productivity for Biggs Ltd and the snack food industry average (shown as an index number, base year = 2017)

Year

Biggs Ltd

Industry average

2020

104.2

104.3

2023

100.3

105.9

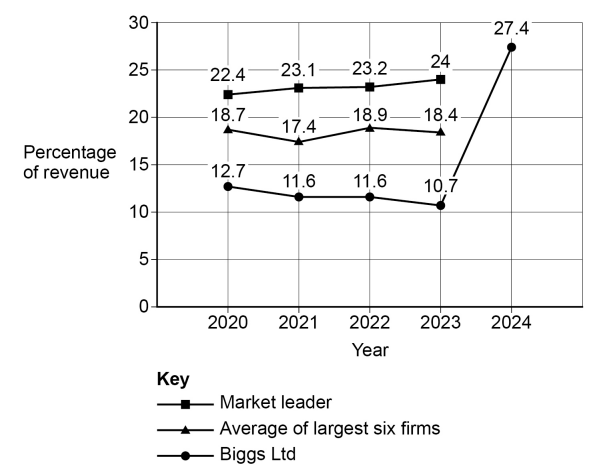
Appendix C Marketing expenditure as a percentage of revenue, 2020–2024*

Line graph showing percentage of revenue from 2020 to 2024 for Market leader, Average of largest six firms, and Biggs Ltd. Biggs spikes to 27.4% in 2024.

* 2024 based on Biggs Ltd’s forecast.

Appendix D Results of market research conducted with families on Biggs Ltd’s new product range and the promotional campaign

Survey question

Average survey score by age group

6 to 16 years

17 to 35 years

36 years and over

I will definitely try the new products when they are available.

9.9

7.2

1.8

The promotional campaign improves my view of Biggs Ltd’s brand.

8.3

6.3

8.0

I frequently consume snack foods at sports events.

8.9

6.9

2.7

Scale: 10 = strongly agree, 5 = neither agree nor disagree, 0 = strongly disagree

Source: Data from 27 interviews with families, conducted by Biggs Ltd in 2021.

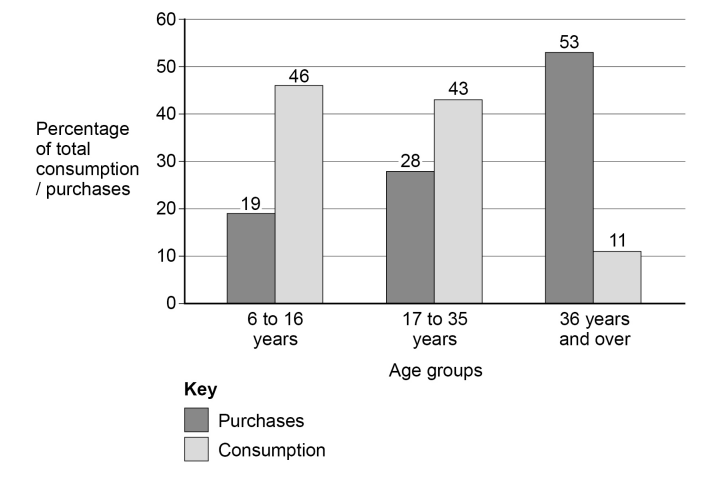
Appendix E Percentage of snack products bought and consumed by different box age groups

Bar chart showing percentages of purchases and consumption by age group: 6-16, 17-35, and 36 and over. Purchases increase with age.

Results from a recent survey of 3000 respondents conducted by an independent market research firm.

Using Appendix A, calculate Biggs Ltd’s payables days ratio for 2023.

5
1 mark

Table 1 Extracts from financial records of Wot plc

£m

Non-current assets

38

Current assets

31

Current liabilities

(18)

Non-current liabilities

(24)

Wot plc receives £20 million from selling ordinary shares.

The company uses this money as follows:

  • £15 million to purchase machinery

  • £3 million to pay off its overdraft

  • £2 million to increase inventory levels.

Calculate Wot plc’s current ratio after these changes

6
4 marks

Case Study

AJS plc

AJS plc is a manufacturer of non-recyclable packaging. This packaging is widely used by takeaway food outlets. AJS plc plans to invest £500 000 in new technology to increase capacity and make its factory more capital intensive.

Appendix A Data on proposed investment (produced by AJS plc’s operations manager)

Year

Annual net cash flow
£000s

Discount factor
(10%)

0

(500)

1.00

1

(50)

0.91

2

250

0.83

3

600

0.75

Appendix B UK market for non-recyclable takeaway food packaging

Line graph of average monthly sales (000 units) from 2016 to 2022, showing a peak at 1300 in 2018, with a decline to 1050 by 2022.

Appendix C UK market for recyclable takeaway food packaging

Line graph showing average monthly sales from 2016 to 2022, rising from 50,000 units in 2016 to 260,000 in 2022, with notable increases in 2020 and 2022.

Appendix D Selected Human Resource data 2022

AJS plc

Industry average

Average salary

£22 000

£26 000

Salary costs as a percentage of turnover (%)

40

35

Labour turnover (%)

15

4

Working days lost through industrial action

24

5

Average number of applicants for vacancies

14

55

Appendix E Selected Financial data for AJS plc

2022

Current assets

£550 000

Current liabilities

£550 000

Non-current liabilities

£4m

Operating profit

£3m

Gearing

22%

Change in the share price of AJS plc over the year

–15%

Change in the share price of the top 100 UK companies over the year

+8%

Using Appendix E, calculate the Return on Capital Employed for AJS plc in 2022.

7
16 marks

Case Study

AJS plc

AJS plc is a manufacturer of non-recyclable packaging. This packaging is widely used by takeaway food outlets. AJS plc plans to invest £500 000 in new technology to increase capacity and make its factory more capital intensive.

Appendix A Data on proposed investment (produced by AJS plc’s operations manager)

Year

Annual net cash flow
£000s

Discount factor
(10%)

0

(500)

1.00

1

(50)

0.91

2

250

0.83

3

600

0.75

Appendix B UK market for non-recyclable takeaway food packaging

Line graph of average monthly sales (000 units) from 2016 to 2022, showing a peak at 1300 in 2018, with a decline to 1050 by 2022.

Appendix C UK market for recyclable takeaway food packaging

Line graph showing average monthly sales from 2016 to 2022, rising from 50,000 units in 2016 to 260,000 in 2022, with notable increases in 2020 and 2022.

Appendix D Selected Human Resource data 2022

AJS plc

Industry average

Average salary

£22 000

£26 000

Salary costs as a percentage of turnover (%)

40

35

Labour turnover (%)

15

4

Working days lost through industrial action

24

5

Average number of applicants for vacancies

14

55

Appendix E Selected Financial data for AJS plc

2022

Current assets

£550 000

Current liabilities

£550 000

Non-current liabilities

£4m

Operating profit

£3m

Gearing

22%

Change in the share price of AJS plc over the year

–15%

Change in the share price of the top 100 UK companies over the year

+8%

With reference to the data provided, would you advise a potential investor to buy shares in AJS plc?

Justify your view.

8
6 marks

Case Study

Homeworking

Homeworking (or teleworking) is the action of working from home, using the Internet, email and the telephone to link the employee and the business remotely.

The number of people working from home has been rising steadily for several years as communications technology has improved.

Table 1 UK labour market data

2019

2020

Number of people in employment (millions)

32.6

32.5

Number of people working at least partly from home (millions)

8.7

Some businesses now adopt homeworking as the normal practice. For example, several financial institutions have reduced the amount of office space they own or rent in city centres. The wider impact of the change has been seen through fewer commuting journeys.

There have been some concerns over increased homeworking due to a reduction in face-to-face communication between employees. There has also been a decline in sales for businesses, such as coffee shops, that rely on office staff as customers.

Some sectors, such as transportation and wholesale, provide few opportunities for people to work from home. Other sectors, such as IT, finance and insurance, provide more homeworking opportunities to staff.

Analyse one way the balance sheet of a business (its statement of financial position) might be affected if more of its employees work from home.

9
16 marks

Case Study

Homeworking

Homeworking (or teleworking) is the action of working from home, using the Internet, email and the telephone to link the employee and the business remotely.

The number of people working from home has been rising steadily for several years as communications technology has improved.

Table 1 UK labour market data

2019

2020

Number of people in employment (millions)

32.6

32.5

Number of people working at least partly from home (millions)

8.7

Some businesses now adopt homeworking as the normal practice. For example, several financial institutions have reduced the amount of office space they own or rent in city centres. The wider impact of the change has been seen through fewer commuting journeys.

There have been some concerns over increased homeworking due to a reduction in face-to-face communication between employees. There has also been a decline in sales for businesses, such as coffee shops, that rely on office staff as customers.

Some sectors, such as transportation and wholesale, provide few opportunities for people to work from home. Other sectors, such as IT, finance and insurance, provide more homeworking opportunities to staff.

Would increased homeworking improve the performance of businesses that use Elkington’s Triple Bottom Line to measure their success?

Justify your view.

10
1 mark

Based on Kaplan & Norton’s Balanced Scorecard model, a policy to increase Research and Development spending on new products by 5% would be an element of the:

  • customer perspective.

  • financial perspective.

  • internal business process perspective.

  • learning and growth perspective.

11
2 marks

Based on the data provided in Table 1 below.

Table 1 includes all of Magpie plc’s current assets and current liabilities at the end of its financial year, ending 31 March 2021. The inventory level on 31 March 2021 is identical to the average level of inventory held during the year.

Table 1 Extracts from financial accounts of Magpie plc

Item

(£m)

Sales revenue

80

Cost of sales

50

Bank overdraft

7

Inventory

8

Payables

12

Receivables

17

Calculate the inventory turnover of Magpie plc.

12
3 marks

Based on the data provided in Table 1 below.

Table 1 includes all of Magpie plc’s current assets and current liabilities at the end of its financial year, ending 31 March 2021. The inventory level on 31 March 2021 is identical to the average level of inventory held during the year.

Table 1 Extracts from financial accounts of Magpie plc

Item

(£m)

Sales revenue

80

Cost of sales

50

Bank overdraft

7

Inventory

8

Payables

12

Receivables

17

Calculate the payables days for Magpie plc.

13
3 marks

Based on the data provided in Table 1 below.

Table 1 includes all of Magpie plc’s current assets and current liabilities at the end of its financial year, ending 31 March 2021. The inventory level on 31 March 2021 is identical to the average level of inventory held during the year.

Table 1 Extracts from financial accounts of Magpie plc

Item

(£m)

Sales revenue

80

Cost of sales

50

Bank overdraft

7

Inventory

8

Payables

12

Receivables

17

Calculate the current ratio for Magpie plc.

14
1 mark

Table 1 below shows efficiency ratios for four different companies.

Table 1 Efficiency ratios for four companies

Ratios

Company

A

B

C

D

Payables days

35 days

35 days

25 days

25 days

Receivables days

25 days

25 days

35 days

35 days

Inventory turnover (times)

15

10

15

10

Based on these ratios, which company is most likely to have the best cash flow?

  • Company A

  • Company B

  • Company C

  • Company D

15
1 mark

Which one of the following perspectives is not used by Kaplan and Norton’s balanced scorecard?

  • Customer

  • External businesses

  • Financial

  • Learning and growth

16
9 marks

The table below shows the changes in the two efficiency ratios for Wilson PLC, 2018–2019.

Ratios

2018

2019

Receivables days

30

45

Payables days

38

43

Analyse the implications of these changes for Wilson PLC’s cash levels.

17
6 marks

Case Study

Drake Hotels PLC owns 20 budget hotels in the UK. Each one is located in a different city. The industry is very competitive and Drake’s managers all have an objective to help the business to be as efficient as possible.

Drake Hotels PLC’s operating profit for the financial year 2019–20 was £18 million. Last month the company appointed a new Chief Executive, Mary Myers, to increase the profitability of the business. Mary was previously the Marketing Manager of an upmarket hotel chain.

Mary is already considering an investment proposal for a luxury hotel in Oxford. This hotel would target overseas visitors who might want to visit the city. Drake Hotels has found a suitable building but needs to invest to develop it.

Appendix A Investment appraisal results for the proposed investment into a new hotel in Oxford (based on net inflows for first eight years).

Average rate of return 12% per year
Net Present Value £25 million

Source: Chief Executive

Appendix B Sensitivity analysis for the new Oxford hotel investment proposal

Two possible changes in the economy that might affect the investment appraisal results in Appendix A

Estimated probability of this change happening

The value of the pound against other currencies is 10% higher than originally forecasted.

20%

The average GDP growth in overseas countries is 1.5% higher than originally forecasted.

30%

Source: Chief Executive

Appendix C Selected financial data for Drake Hotels PLC

£ million as at 1 May 2020

Current assets

15

Current liabilities

18

Total equity

170

Non-current liabilities

280

Appendix D Forecasted data for Drake Hotels PLC’s new Oxford hotel investment proposal

Initial investment required £20 million
Estimated income elasticity of demand +2
Percentage of customers visiting from overseas 70%
Estimated cost of borrowing for this investment 8% per annum

Appendix E Room bookings by month and day of the week in Drake Hotels PLC’s budget hotels 2019

Bar chart showing monthly room bookings index. Peaks in June to September at around 160. Lower in January to May, October to December, around 70-100.
Bar chart of room bookings index by day: Low on weekdays, highest on Saturday, moderate on Sunday, with Friday above average. Average bookings index is 100.

Using the data in Appendix C, calculate the following ratios for Drake Hotels PLC in 2020.

Current ratio .......................................................................................................

Gearing ratio ......................................................................................................

18
16 marks

Read the case study in the Insert (opens in a new tab).

Elaine’s view is that Personal Care was Sunport PLC’s most successful division in box Europe in 2019.

To what extent do you agree with Elaine’s view?

You should support your answer using Appendix D and the other information provided.

19
4 marks

A business has non-current liabilities of £200 000 and a gearing ratio of 40%. It then takes out a long-term loan of £100 000 from the bank.

Calculate its new gearing ratio after taking out this bank loan.

20
25 marks

More businesses are now using broad measures of overall business performance, such as Kaplan & Norton’s Balanced Scorecard and Elkington’s Triple Bottom Line, rather than focusing solely on financial ratio analysis.

To what extent does this mean that financial ratio analysis is no longer important to a business?

21
1 mark

A business has more current liabilities than current assets and shareholders provide 90% of its capital employed.

This business has

  • a high current ratio and high gearing.

  • a high current ratio and low gearing.

  • a low current ratio and high gearing.

  • a low current ratio and low gearing.

22
2 marks

Case Study

Marks and Spencer plc is one of the UK’s leading retailers. It provides its own-brand food, clothing and home products in 1433 stores worldwide and online.

Appendix A Extracts from Marks and Spencer plc’s published
financial accounts

Balance sheet as at 1 April 2017

£ million

Assets

Non-current assets

6 569

Current assets

1 723

Liabilities

Current liabilities

2 368

Non-current liabilities

2 774

Net assets

3 150

Equity

Total equity

3 150

Appendix B Marks and Spencer plc’s revenue and operating profit
2013–14 to 2016–17

Bar chart displaying revenue and operating profits in millions from 2013–2017. Revenue is shown in grey, profits in black, with profits ranging from 584-701.

Appendix C Marks and Spencer plc customer data for financial
year ending 1 April 2017

Total number of customers

Percentage change on previous year

Average number of times a year a customer buys from Marks & Spencer

Percentage change on previous year

Food

20.5 million

+2.0%

22.5

0%

Clothing and home

24.6 million

0%

7.2

–5.3%

Appendix D Marks and Spencer plc online data

2016–17

Percentage change on previous year

Total online revenue

£836.3 million

+5.6%

Weekly site visits

8.3 million

+11%

Appendix E Information on Marks and Spencer plc’s Board of
Directors in 2017

International experience: directors come from the following
countries

China Germany Hong Kong India Japan Italy

UK Spain Netherlands Poland South Africa USA

Gender diversity: 70% of directors are male, 30% female

Industry sector experience of directors: retail 90%, consumer 100%, finance 60%, e-commerce and technology 40%

Appendix F Marks and Spencer plc’s share price

Line graph showing price in pence from 2015 to 2017, peaking above 600 in 2015, then declining to stabilise around 300-400 by 2017.

Explain, with an example, what is meant by non-current assets.

23
9 marks

Case Study

Marks and Spencer plc is one of the UK’s leading retailers. It provides its own-brand food, clothing and home products in 1433 stores worldwide and online.

Appendix A Extracts from Marks and Spencer plc’s published
financial accounts

Balance sheet as at 1 April 2017

£ million

Assets

Non-current assets

6 569

Current assets

1 723

Liabilities

Current liabilities

2 368

Non-current liabilities

2 774

Net assets

3 150

Equity

Total equity

3 150

Appendix B Marks and Spencer plc’s revenue and operating profit
2013–14 to 2016–17

Bar chart displaying revenue and operating profits in millions from 2013–2017. Revenue is shown in grey, profits in black, with profits ranging from 584-701.

Appendix C Marks and Spencer plc customer data for financial
year ending 1 April 2017

Total number of customers

Percentage change on previous year

Average number of times a year a customer buys from Marks & Spencer

Percentage change on previous year

Food

20.5 million

+2.0%

22.5

0%

Clothing and home

24.6 million

0%

7.2

–5.3%

Appendix D Marks and Spencer plc online data

2016–17

Percentage change on previous year

Total online revenue

£836.3 million

+5.6%

Weekly site visits

8.3 million

+11%

Appendix E Information on Marks and Spencer plc’s Board of
Directors in 2017

International experience: directors come from the following
countries

China Germany Hong Kong India Japan Italy

UK Spain Netherlands Poland South Africa USA

Gender diversity: 70% of directors are male, 30% female

Industry sector experience of directors: retail 90%, consumer 100%, finance 60%, e-commerce and technology 40%

Appendix F Marks and Spencer plc’s share price

Line graph showing price in pence from 2015 to 2017, peaking above 600 in 2015, then declining to stabilise around 300-400 by 2017.

Calculate the following ratios for Marks and Spencer plc for the financial year ending box 1 April 2017 to two decimal places. [9 marks]

The return on capital employed _________________________________

Workings__________________________________________________

The gearing ratio ____________________________________________

Workings__________________________________________________

The current ratio _____________________________________________

Workings___________________________________________________

24
1 mark

The information below is an extract from a company’s annual accounts.

  • Current assets: £3 million

  • Current liabilities: £2.4 million

  • Non-current liabilities: £4.2 million

  • Capital employed: £12 million

The company’s gearing ratio is

  • 35%

  • 250%

  • 20%

  • 5%

25
25 marks

A business has recently started to use Elkington’s Triple Bottom Line to assess its overall performance.

To what extent do you think the business is likely to have lower profits as a result of this?

26
12 marks

Read the case study in the Insert.

Analyse, using two financial ratios, the financial constraints faced by KMH plc in attempting to fund the new strategy.