Strategic Positioning (AQA A Level Business): Exam Questions

Exam code: 7132

1 hour7 questions
1
9 marks

Case Study

Soundcheck plc

Soundcheck plc offers a streaming service enabling users in more than 160 countries to play a variety of content, such as music and podcasts, on electronic devices. The company initially offered its services free to consumers and earned revenue from advertisers. An additional, paid service was introduced in 2022. Paying subscribers benefit from better quality audio, no adverts, and playlists made by celebrities. Exclusive podcast content also provides paying subscribers with an enhanced experience which justifies a paid subscription model.

Since its launch in 2006, Soundcheck plc has grown to become the market leader. It now employs nearly 4000 staff globally. A stock market flotation has funded huge investment in building a high-quality technology platform, strong brand and a skilled workforce. However, Soundcheck plc has not regularly made an operating profit. Its costs have been rising significantly in recent years and in 2023 it lost £26 million as a global economic slowdown began.

In 2023, Soundcheck plc reached an agreement with trade unions about pay rates and ways of working. The agreement guaranteed starting salaries of at least £36 000 to many staff. This is significantly higher than the industry average. However, there is a global shortage of skilled software engineers and marketing staff so labour turnover rates remain high. In addition to competition for staff, new competitors are attracted to the growing market, including large rivals who are well established in other streaming markets. Other new entrants have also targeted the ‘free’ sector of the market. Some of these rivals have a competitive advantage because they own the rights to music or other content and so have lower costs than Soundcheck plc.

Chart with a circular diagram divided into eight segments, labelled 1-8. Arrows show price and perceived value axes ranging from low to high.

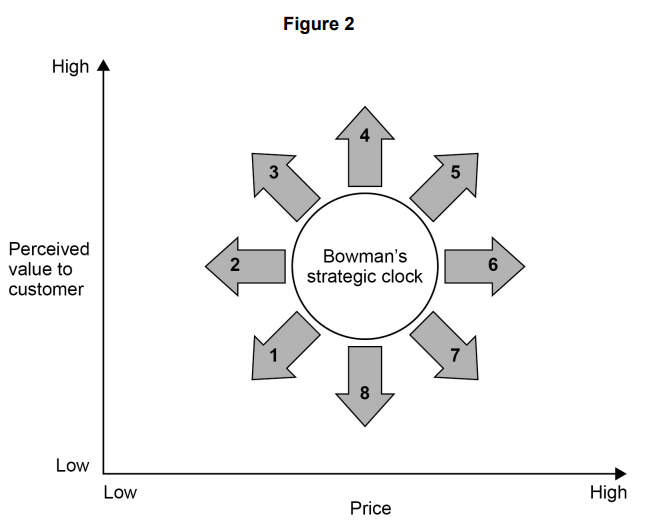
When introducing its paid service, Soundcheck plc changed its positioning strategy from position 1 to position 4 on Bowman’s strategic clock.

Analyse why Soundcheck plc decided to change its positioning strategy.

2
1 mark

Figure 2 shows Bowman’s strategic clock.

Diagram of Bowman's strategic clock with eight strategic positions around a circle, plotting perceived value against price from low to high.

Which positions did Bowman consider to be undesirable strategies?

  • 1, 2 and 3

  • 1, 7 and 8

  • 4, 5 and 6

  • 6, 7 and 8

3
25 marks

A business is changing from a strategic position of low cost to one of differentiation.

Will this lead to the business spending more on marketing and less on the operations function? Justify your view.

4
1 mark

Which one of these strategies from Bowman’s strategic clock is most likely to be a successful long-term strategy?

  • High price and low added value

  • High price and standard added value

  • Low price and low added value

  • Standard price and low added value

5
25 marks

A competitive advantage can be achieved through low-cost or through differentiation.

Which of these types of competitive advantage is it easier for a UK business to maintain? Justify your view.

6
1 mark

The grid below shows a market map for television sets.

High quality

Low quality

High price

A

B

Low price

C

D

Based on Bowman’s strategic clock, the manufacturer of a television uses a strategy of focused differentiation.

In which segment of the market map is this television most likely to be placed?

  • A

  • B

  • C

  • D

7
20 marks

Case Study

The rise of the discount food retailers

For many years four companies have dominated food retailing sales in the UK: Asda, Morrisons, Sainsbury’s and Tesco. However, these ‘big four’ retailers have faced growing competition from discount retailers such as Aldi and Lidl.

Figure 1: Total UK food retail sales

Line graph showing market value in £000m from 2011-2020, with actual values rising to 157 by 2015, and forecast ranging from 142 to 185 by 2020.

Figure 2: UK food retail sales of discount food retailers

Line graph of market value (£000 million) from 2011 to 2015 with forecasts to 2020, showing actual and forecast values with a 95% confidence interval.

Figure 3: A comparison of the ‘big four’ model with the discounter model

The typical discounter model (eg Aldi, Lidl)

‘Big four’ model (eg Tesco, Sainsbury’s)

Product range in stores

Relatively smalleg 800 items

Largeeg 50 000 items

Brands

Large proportion of own label products traditionally targeting low to medium income earners

Large proportion of well-known brands traditionally targeting high to medium income earners

Sales of food compared to non-food items (eg clothing and health and beauty products)

80%:20%

60%:40%

Administration costs and overheads as percentage of turnover

15%

20%

Typical profit margin

3%

2%

Figure 4: Market map of the UK food retail sector

Scatterplot showing market shares of discounters and big 4 in 2012 and 2016. Axes are price and customer perception of benefits. The big 4's share decreases.

Figure 5: Extract from consumer survey:

“What benefit is most important in determining where you shop?”

Benefit

% of replies

I can rely on what I need being in stock

16

It has a good range of non-food products

17

It has well trained, helpful staff readily available

18

The stores are well designed and maintained

14

Figure 6: Company and Human Resource Data

Aldi Stores Ltd (discount retailer) 2014

Tesco (one of the ‘big four’) 2014

Turnover

£6 893 million

£54 443 million

Profit for the year

£250 million

£162 million

Average salary per employee

£21 272

£14 452

Total employee costs

£507 million

£6 968 million

Number of employees

23 858

482 152

To what extent do you think the ‘big four’ supermarkets should change their strategies and adopt the discounter model?