Understanding Poverty (Cambridge (CIE) A Level Economics): Revision Note
Exam code: 9708

Absolute and relative poverty
Absolute poverty is a condition in which an individual lacks the minimum resources necessary for basic survival
They have insufficient income to meet basic needs such as food, shelter, clean water and healthcare
It is defined against a fixed standard that does not change as average living standards rise
The World Bank defines the international absolute poverty line as living on less than $3.00 per person per day (2025, purchasing power parity)
Relative poverty is a condition in which an individual's income falls significantly below the average standard of living in their society
This is typically defined as below 50% or 60% of median household income
It is determined by comparing against a moving standard that rises as average incomes rise — meaning relative poverty can persist or worsen even as absolute poverty falls
Relative poverty is therefore a measure of inequality as much as deprivation
Relative poverty exists in all economies, including high-income ones
Key distinction
Feature | Absolute poverty | Relative poverty |
|---|---|---|
Standard | Fixed minimum threshold | Relative to average living standards |
Changes as incomes rise? | No — threshold is fixed | Yes — threshold rises with median income |
Measure of | Deprivation | Inequality |
Most relevant to | Low-income economies | All economies, including high-income |
Example threshold | World Bank $2.15/day | Below 60% of median income |
Case Study
Absolute vs relative poverty in India
The context
India's rapid economic growth since the liberalisation reforms of the 1990s provides a striking illustration of the distinction between absolute and relative poverty - dramatic progress on one measure alongside deterioration on the other.
Actions taken
Market liberalisation drove technology-led growth, particularly in services and manufacturing
MGNREGA guaranteed rural employment, directly targeting absolute poverty
Direct benefit transfers channelled food, fuel and fertiliser subsidies to low-income households
Outcomes
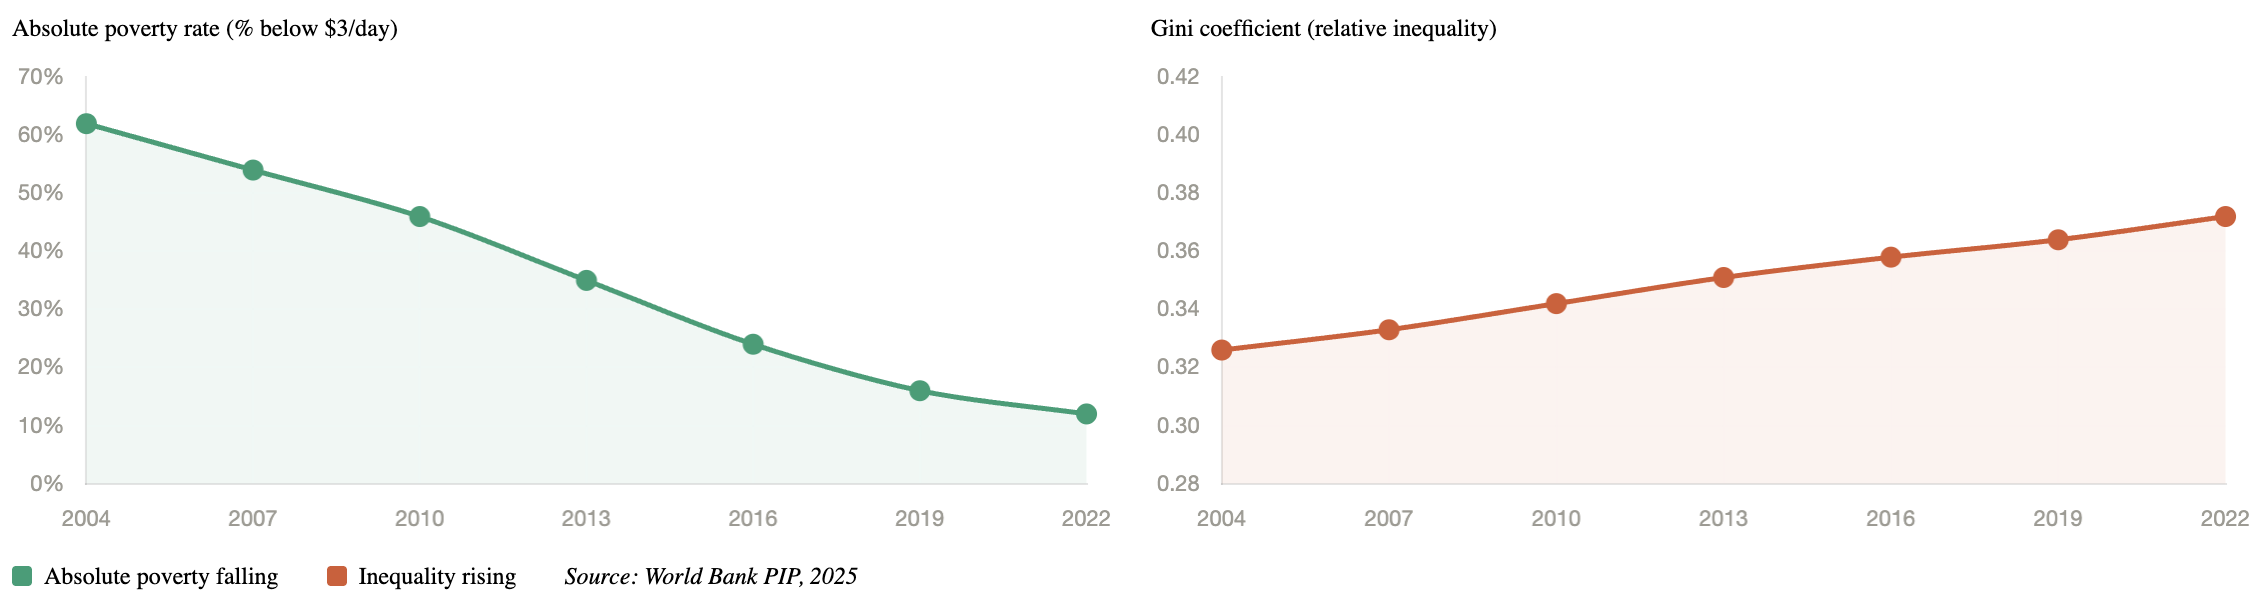
The share of Indians living in absolute poverty fell from over 40% in 2011 to under 12% by 2022 - hundreds of millions lifted out of extreme deprivation
Under the updated $3.00 per day line (2025 PPP), progress remains significant
However India's Gini coefficient rose during the same period, with the wealthiest 1% capturing a disproportionate share of national income
This illustrates that rapid growth can simultaneously reduce absolute poverty while worsening relative poverty
The poverty trap
The poverty trap occurs when individuals receiving means-tested benefits face such a high effective marginal tax rate as they move into work that the financial gain from working is negligible or negative - creating a disincentive to work
It arises from the interaction of two simultaneous effects as earned income rises:
Benefit withdrawal
means-tested benefits are reduced or removed as income rises
Income tax and social contributions
earned income becomes subject to taxation
Together these can create an effective marginal tax rate
the combined rate at which additional earned income is lost to tax and benefit withdrawal can exceed 80% or even 100% in some systems
The individual then faces a rational calculation at the margin
If the financial gain from working is negligible, and work involves additional costs such as transport and childcare, remaining on benefits may be the rational choice
This is a direct application of the margin and decision-making key concept — work does not pay at the margin
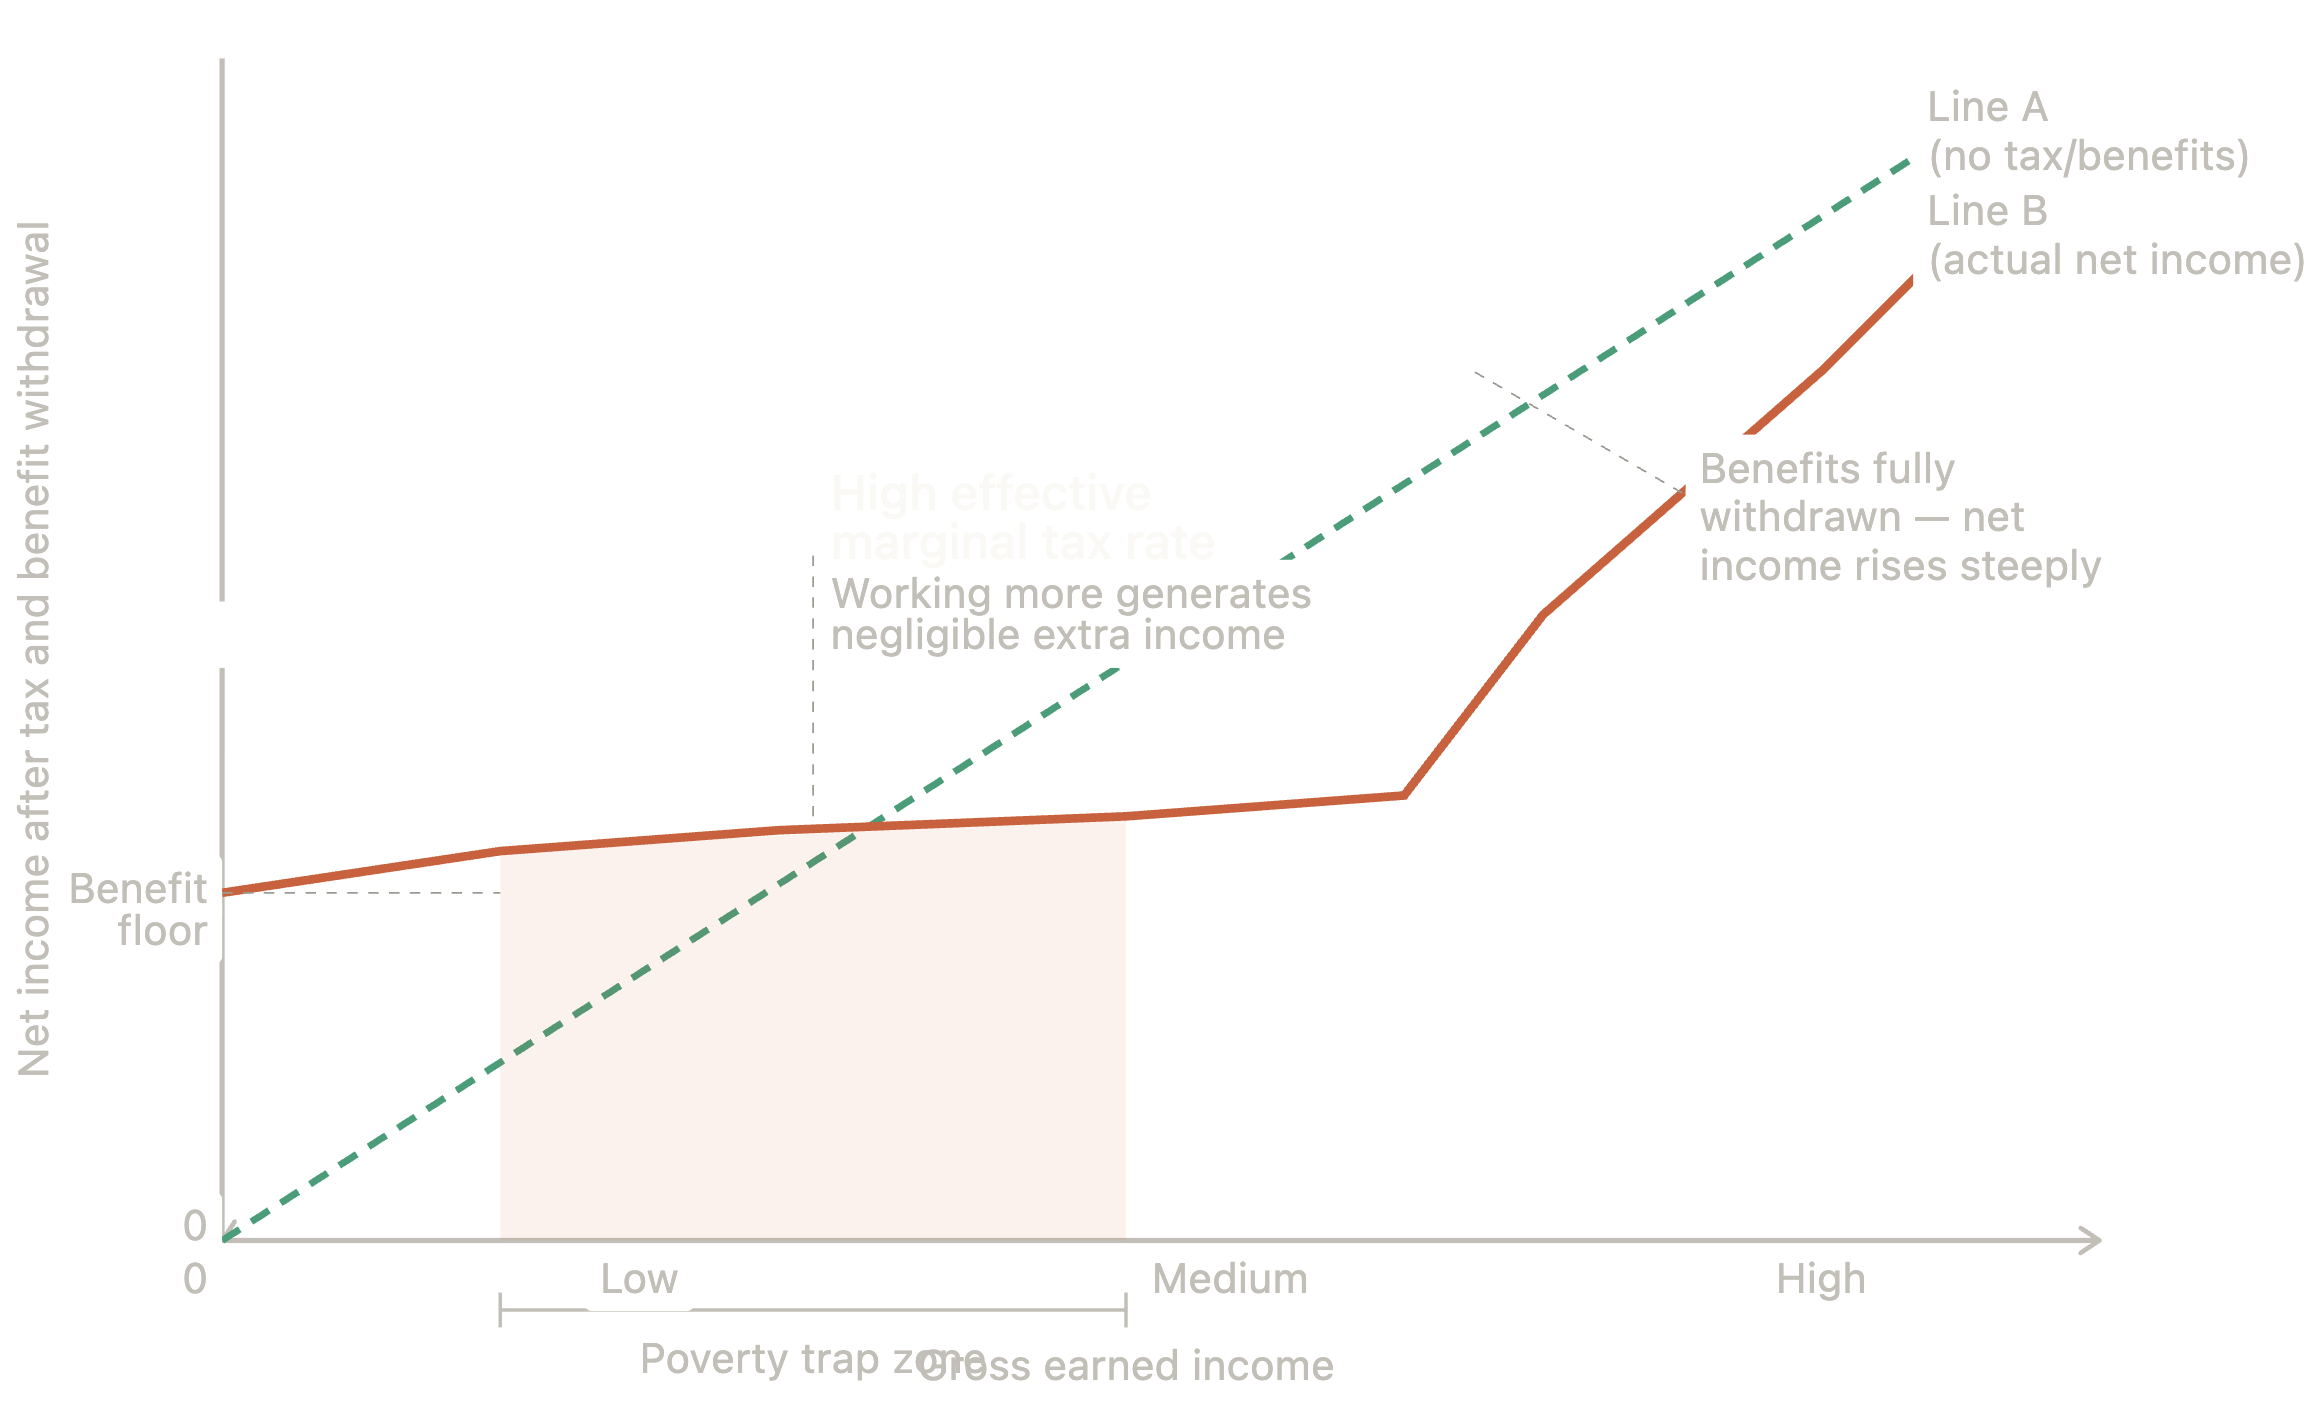
Diagram analysis
Line A (45°) shows net income with no tax or benefit withdrawal - every unit earned is kept
Line B starts above zero, reflecting the benefit floor received by those not working
As earned income rises, Line B is nearly flat - benefit withdrawal and taxation offset additional earnings, creating the poverty trap zone
Once benefits are fully withdrawn, Line B rises steeply - work finally pays at the margin
Throughout the trap zone, Line B lies well below Line A - illustrating how little individuals actually keep from additional earnings
Evaluating the poverty trap
Point | Explanation |
|---|---|
Disincentive to work |
|
Rational behaviour |
|
Equity concern |
|
Policy trade-off |
|
Measurement difficulty |
|
Examiner Tips and Tricks
The poverty trap is fundamentally about the margin and decision-making: individuals compare the marginal financial gain from working against its costs. When the effective marginal tax rate is very high, work does not pay at the margin - this is rational behaviour, not laziness.
The strongest evaluative point is the policy trade-off: eliminating the poverty trap requires either reducing benefit levels (worsening equity) or increasing government spending (fiscal cost). There is no costless solution

Unlock more, it's free!
Join the 100,000+ Students that ❤️ Save My Exams
the (exam) results speak for themselves:

Was this revision note helpful?
