An object is dropped from a cliff. The object falls vertically for 13.8 seconds before hitting the ground.
The percentage uncertainty in this measurement of time is estimated to be ±5%.
Explain what is meant by the uncertainty in a measurement.
A guidebook of the local area states the height of the cliff is 940 ± 10 m.
Calculate the acceleration of free-fall of the object and its absolute uncertainty to an appropriate number of significant figures.
The only instrument used in this experiment was a stopwatch.
(i) Suggest one possible source of systematic error and one source of random error in this investigation.
[2]
(ii) Explain how these errors could influence the value of acceleration of free fall of the object determined in part (a).
[2]
A student repeats the experiment in a lab to determine a value for the acceleration due to gravity.
The time t for a spherical object to fall freely through a vertical distance s is measured.
The table shows the data collected.
s / m | t1 / s | t2 / s | t3 / s | mean t / s | t2 / s2 |
0.100 | 0.140 | 0.135 | 0.147 |
|
|
0.200 | 0.201 | 0.205 | 0.209 |
|
|
0.300 | 0.240 | 0.246 | 0.250 | 0.245 | 0.060 |
0.400 | 0.285 | 0.282 | 0.290 | 0.286 | 0.082 |
0.500 | 0.315 | 0.319 | 0.323 | 0.319 | 0.102 |
0.600 | 0.345 | 0.349 | 0.354 | 0.349 | 0.122 |
0.700 | 0.375 | 0.379 | 0.383 | 0.379 | 0.144 |
0.800 | 0.399 | 0.405 | 0.407 |
|
|
0.900 | 0.424 | 0.428 | 0.434 |
|
|
(i) Complete the final two columns of the table.
[3]
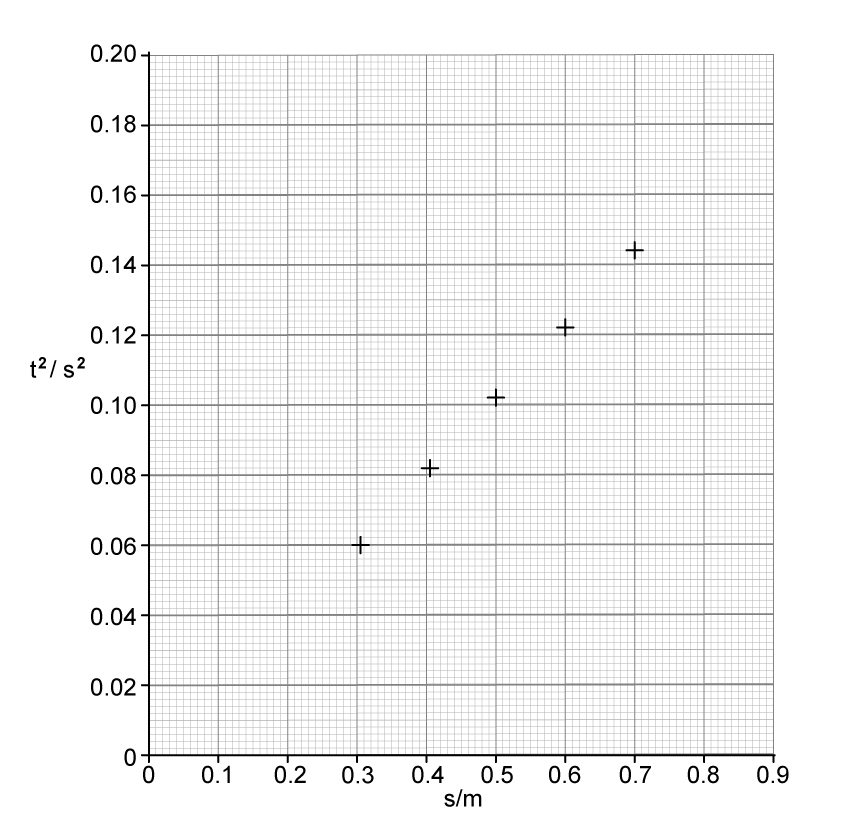
(ii) Plot the missing data points on the graph above.
Draw the error bars and a line of best fit.
[3]
The uncertainty in each value of s is ± 0.002 m.
(i) Use the graph to calculate the value of g for this experiment.
[5]
(ii) Use the graph to calculate the percentage uncertainty of the value.
[3]
Was this exam question helpful?