Syllabus Edition
First teaching 2025
First exams 2027
Major Depressive Disorder (MDD) Across Cultures (DP IB Psychology): Revision Note

Major depressive disorder (MDD) across cultures
In Paper 3, the HL content isn’t tested directly
Instead, you’ll analyse a source based on one HL extension and apply it to the given context
For example, with a culture & MDD source, you may be asked to focus on issues like:
Small/unrepresentative samples (weak generalisability)
Unclear variables/measures (limited interpretability)
Correlational data (no causal inference)
Missing context or data (e.g., number of participants or timeframe), leading to tentative conclusions
Worked Example
Here is an example of a Paper 3 source and a 3-mark SAQ using culture (HL extension) in the Health & Wellbeing context:
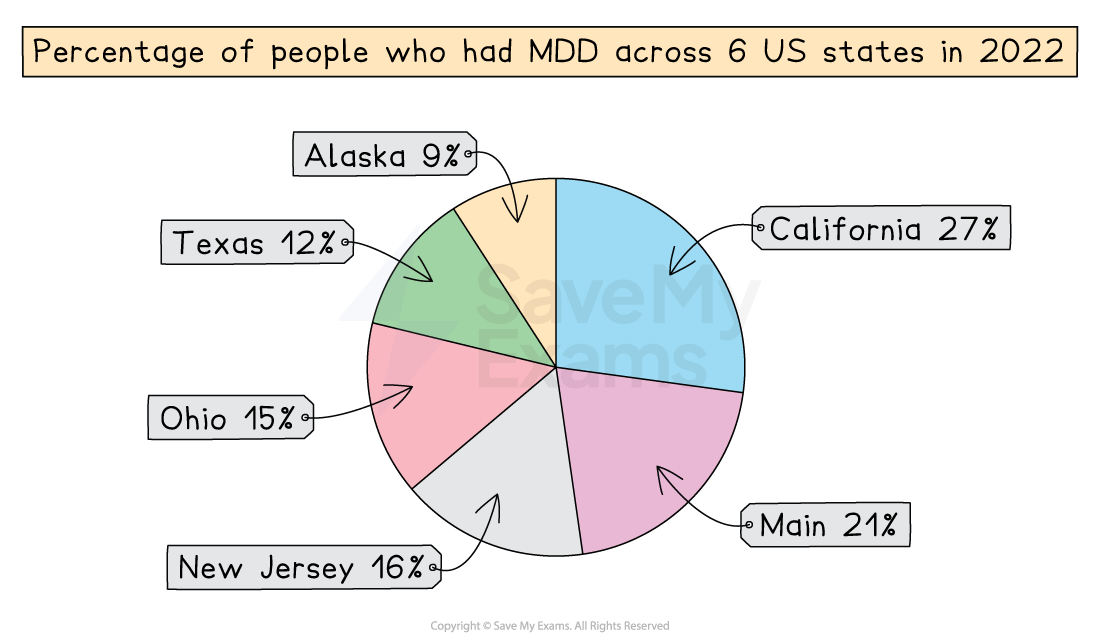
Source 1:
Q1. Explain one limitation linked to the interpretation of the data in this source.
[3 marks]
Model answer:
The graph in the source shows which states have a high prevalence of MDD but, taken alone as bare statistics, it suggests no reasons for these prevalence rates, i.e., it lacks explanatory power as to cultural differences within the USA as a whole.
or
The data may have been gathered using a range of methods (some of which may not have been well controlled), which means that there could be issues with the consistency of data gathering. This means that it may lack reliability.
or
MDD may be reported and/or diagnosed more in some states (e.g., California) than others (e.g., Alaska), which means that the graph may not represent the true figures for the prevalence of MDD across US states. This means it may lack validity.
Guidance:
Use only the information provided by the graph/chart: do not 'invent' data or make assumptions as to what may be behind the data; e.g., the highest rates of MDD are shown to be in California that does not 'prove' that MDD is higher there, simply that has been reported more frequently there than other states
Do not write too much – there are only 3 marks available for this question and you need time to complete the higher-value questions on this paper
The question is asking for one limitation so don't provide two or more, as you will not be rewarded for this
The question is asking for what limits interpretation of the data so don't waste time/marks by stating any advantages/strengths

Unlock more, it's free!
Join the 100,000+ Students that ❤️ Save My Exams
the (exam) results speak for themselves:

Was this revision note helpful?
