Syllabus Edition
First teaching 2025
First exams 2027
Answering SAQs - Paper 3: Question 1 (HL Only) (DP IB Psychology): Revision Note

Paper 3 - question 1
Paper 3 consists of three compulsory SAQs based on a claim and research sources
Question 1 is worth 3 marks
Questions 2 and 3 are worth 6 marks each
The SAQs are worth a total of 15 marks
The examiners are looking for:
how well you interpret quantitative and qualitative data
Research methods in Paper 3
Research methods are assessed throughout Paper 3
The exam includes:
Source 1: usually a graph or table, used only for Question 1
A source booklet: 3–5 short research summaries (quantitative and qualitative)
The question could relate to any of the HL extension topics:
Culture
Motivation
Technology
The question will also be linked to one of the contexts:
Health & wellbeing
Human development
Human relationships
Learning & cognition
Example Question 1
Explain one issue that limits the interpretation of the information shown in source 1 [3 marks]
How to approach Question 1
Identify what the data shows (brief interpretation)
Explain one clear limitation of the data in terms of research methods or validity
Link the limitation to why the graph/chart may not fully support a strong conclusion
Example limitation points:
The graph may not show cause and effect (correlation does not equal causation)
The data may be based on a small or unrepresentative sample
The chart may lack qualitative detail, meaning we don’t know the reasons behind the numbers
The data may be too simplistic, missing important variables
Worked Example
Here is an example of a Paper 3 source and a 3-mark SAQ using technology (HL extension) in the Health & Wellbeing context:
Source 1:
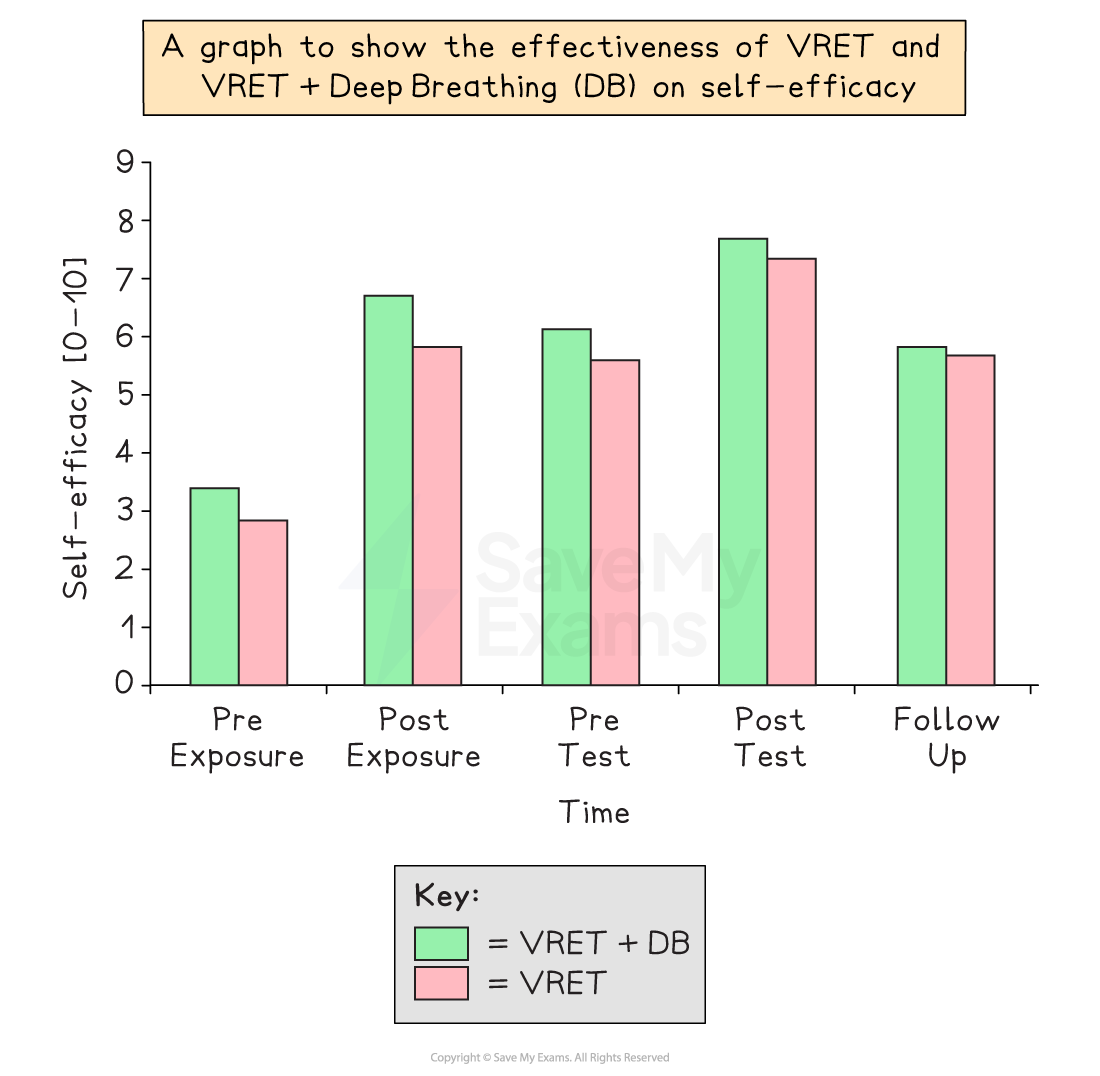
A graph to show the effectiveness of VRET and VRET + Deep Breathing (DB) on self-efficacy
Q1. Explain one limitation linked to the interpretation of the data in this source.
[3 marks]
Model answer:
Self-efficacy was measured on a scale of 0-10 (see the y-axis). This is a limitation, as self-efficacy is a subjective variable (it means different things to different people) so it may defy quantitative measurement.
or
The x-axis does not indicate how much time has passed between each measurement, which means that it is not possible to form a meaningful conclusion about the long-term effects of VRET compared to VRET + DB.
Guidance
Use only the information provided by the graph/chart: do not 'invent' data or make assumptions as to what may be behind the data, e.g., what the VRET consisted of or your own opinions on VRET generally
Do not write too much – there are only 3 marks available for this question and you need time to complete the higher-value questions on this paper
The question is asking for one limitation so don't provide two or more, as you will not be rewarded for this
The question is asking for what limits interpretation of the data so don't waste time/marks by stating any advantages/strengths
Worked Example
Here is an example of a Paper 3 source and a 3-mark SAQ using culture (HL extension) in the Health & Wellbeing context:
Source 1:
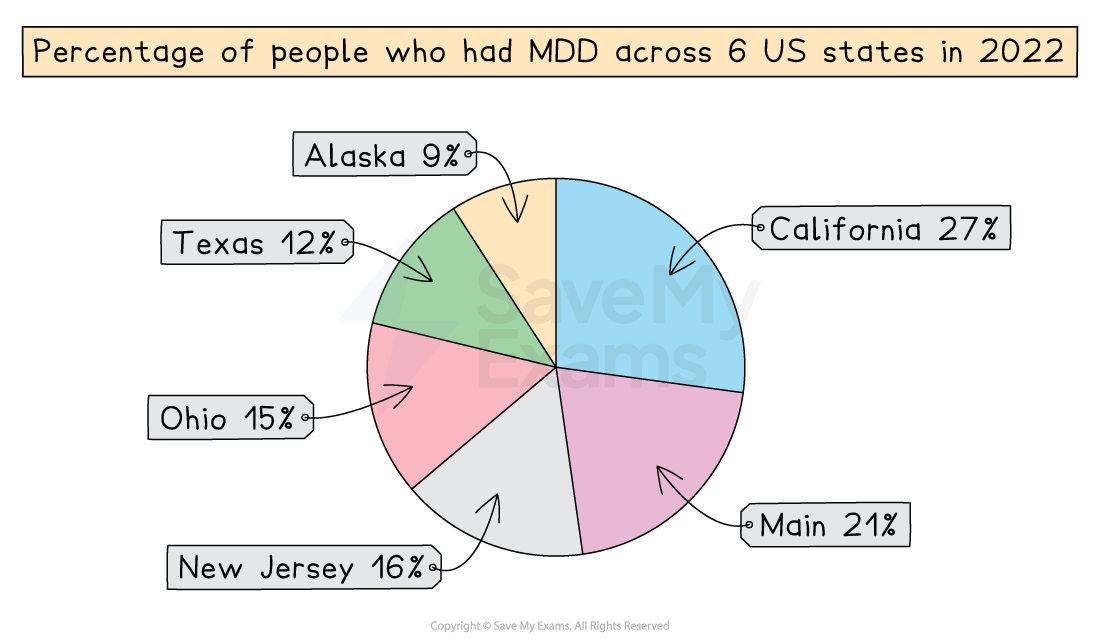
Q1. Explain one limitation linked to the interpretation of the data in this source.
[3 marks]
Model answer:
The graph in the source shows which states have a high prevalence of MDD but, taken alone as bare statistics, it suggests no reasons for these prevalence rates, i.e., it lacks explanatory power as to cultural differences within the USA as a whole.
or
The data may have been gathered using a range of methods (some of which may not have been well controlled), which means that there could be issues with the consistency of data gathering. This means that it may lack reliability.
or
MDD may be reported and/or diagnosed more in some states (e.g., California) than others (e.g., Alaska), which means that the graph may not represent the true figures for the prevalence of MDD across US states. This means it may lack validity.
Guidance:
Use only the information provided by the graph/chart: do not 'invent' data or make assumptions as to what may be behind the data; e.g., the highest rates of MDD are shown to be in California that does not 'prove' that MDD is higher there, simply that has been reported more frequently there than other states
Do not write too much – there are only 3 marks available for this question and you need time to complete the higher-value questions on this paper
The question is asking for one limitation so don't provide two or more, as you will not be rewarded for this
The question is asking for what limits interpretation of the data so don't waste time/marks by stating any advantages/strengths

Unlock more, it's free!
Join the 100,000+ Students that ❤️ Save My Exams
the (exam) results speak for themselves:

Was this revision note helpful?
