Syllabus Edition
First teaching 2025
First exams 2027
Box & Whisker Plots (DP IB Psychology): Revision Note

Box & whisker plots
Box and whisker plots are used when researchers are interested in splitting data up into quartiles
Often, data will contain extreme values
E.g., there are more people with an IQ of around 100 than there are people with an IQ of 130
If a researcher collects 50 IQ scores, 49 being from 'normal' people but one from a 'genius' (with an IQ of 130), then the 'genius' score would not fit in with the other data
Using quartiles and drawing a box and whisker plot allows researchers to split the data so that they can see what is happening at the low, middle and high points
This allows them to also consider any possible extreme values
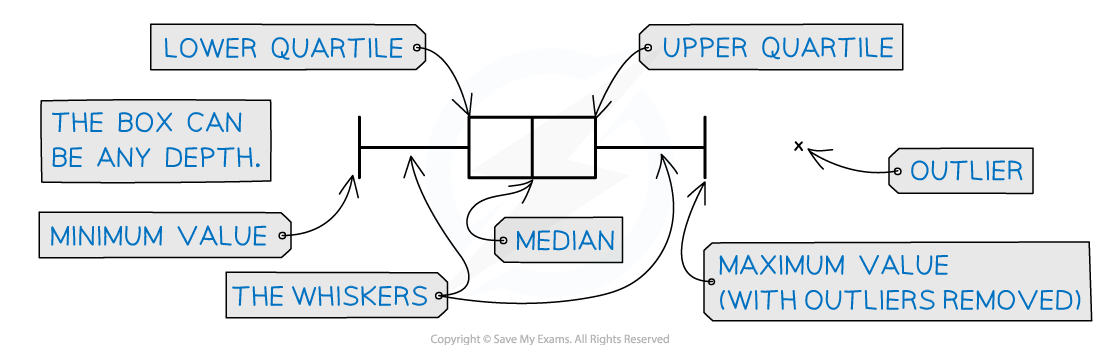
Box and whisker plots include the following five values:
Lowest data value
Lower quartile
Median
Upper quartile
Highest data value
On graph paper, box and whisker plots are drawn with the five values marked by short vertical lines
The middle three values then form a box with the median line inside
the median will not necessarily be in the middle of the box!
The box represents the interquartile range (middle 50% of the data)
The lowest data value and highest data value are joined to the box by horizontal lines:
these are the 'whiskers'
they represent the lowest 25% of the data and the highest 25% of the data
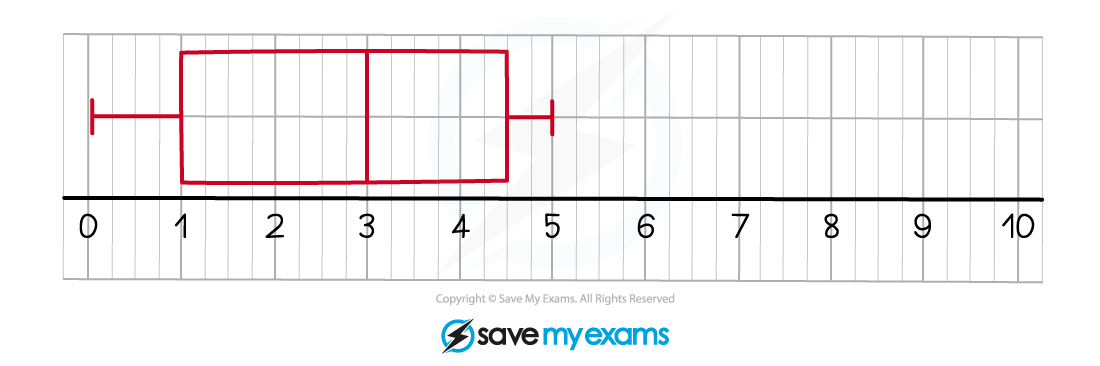
The box and whisker plot below shows the number of items recalled by a class of four-year-old children when tested once a week over a month:
The median is 3 items
The upper quartile is 4.5 items
The lower quartile is 1 item
The whiskers show the maximum value of 5 items and the minimum value of 0 items

Unlock more, it's free!
Join the 100,000+ Students that ❤️ Save My Exams
the (exam) results speak for themselves:

Was this revision note helpful?
