Syllabus Edition
First teaching 2025
First exams 2027
Technology & Learning (DP IB Psychology): Revision Note

Technology & learning
Worked Example
Here is an example of a Paper 3 source and a 6-mark SAQ using technology (HL extension) in the Learning & Cognition context:
Source 2
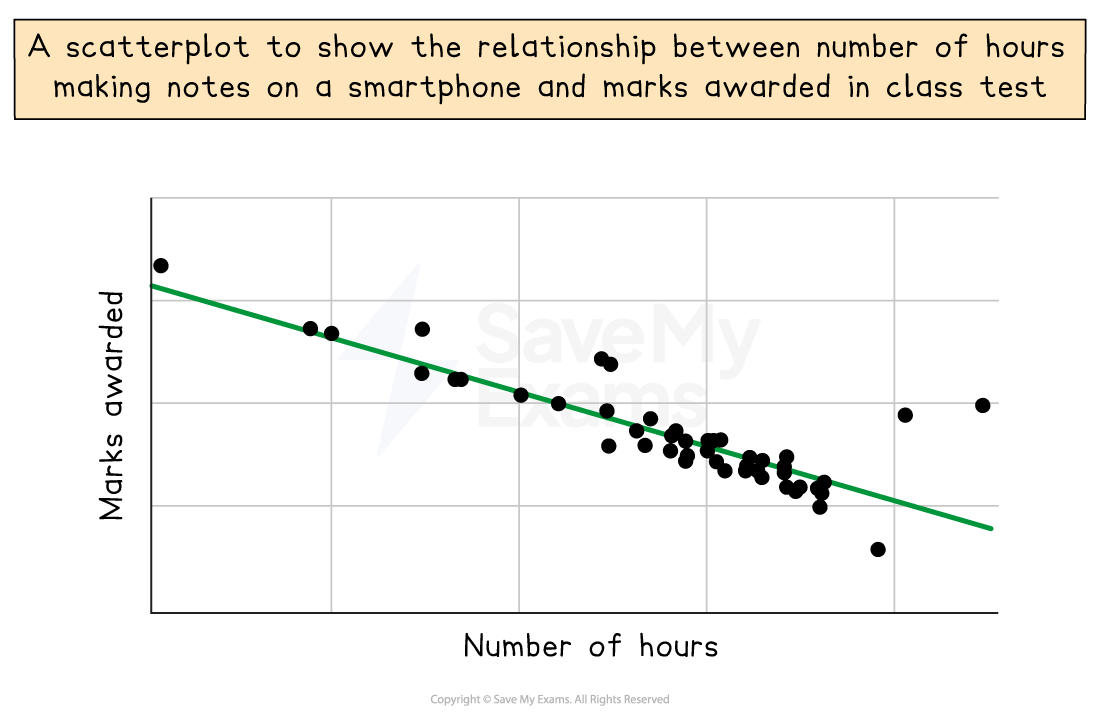
Q2: Analyse the findings from source 2 and state a conclusion based on these findings.
[6 marks]
Model answer
The data is in the form of a scatterplot in which the co-variables are the number of hours making notes on a smartphone and marks awarded in a class test. The graph shows that there is a reasonably strong negative relationship between the two variables. There are some outliers but not enough to significantly detract from the general negative trend of the data. The researcher may conclude that making class notes using a smartphone impedes learning, as evidenced by its relationship to marks gained in class tests.
As this research is a correlation, however, the researcher will not be able to confidently conclude that making notes on a smartphone impedes learning, as there is no way of establishing cause-effect between the two variables. Thus, it is unclear as to whether making notes on a smartphone impairs test performance.
Guidance
Your analysis should refer to the raw scores (if these are included) and/or the descriptive/inferential statistics presented in the findings
For descriptive stats this may comprise the mean/median/mode as measures of central tendency and the range/standard deviation as measures of dispersion
For inferential stats this may comprise a statement of significance and/or link to the level of probability used
You should always state which condition of the IV performed better
You should comment on what the stats seem to suggest about performance per condition
If relevant, you should comment on what the data tells you about the population, e.g., is this a normal distribution or is it skewed?
If the research is qualitative then you should focus on how the findings have been categorised/presented and whether there are drawbacks or limitations to how it has been gathered (e.g., sample size, potential bias)
You should draw a conclusion based on what the data in the source/study tells you about what is being investigated
E.g., do the findings suggest that X does affect Y?

Unlock more, it's free!
Join the 100,000+ Students that ❤️ Save My Exams
the (exam) results speak for themselves:

Was this revision note helpful?
