Syllabus Edition
First teaching 2025
First exams 2027
Production Possibility Curves (Cambridge (CIE) IGCSE Economics): Revision Note
Exam code: 0455 & 0987
Production possibility curves (PPC)
The production possibility curve (PPC) is an economic model that considers the maximum possible production (output) that a country can generate if it uses all of its factors of production to produce only two goods/services
Any two goods/services can be used to demonstrate this model
Many PPC diagrams show capital goods and consumer goods on the axes
Capital goods are assets that help a firm or nation produce output (manufacturing)
For example, a robotic arm in a car manufacturing company is a capital good
Consumer goods are end products and have no future productive use
For example, a watch or a pair of trousers

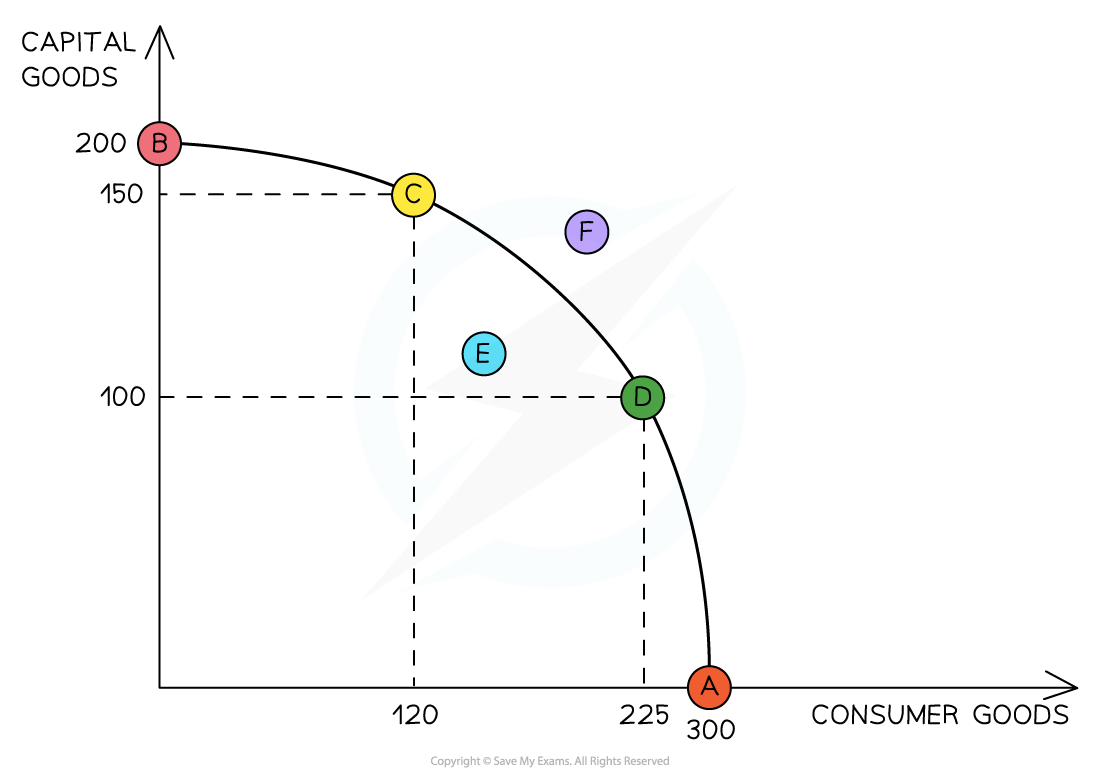
Diagram explanation
The use of PPC to depict the maximum productive potential of an economy
The curve demonstrates the possible combinations of the maximum output this economy can produce using all of its resources (factors of production)
At A, its resources are used to produce only consumer goods (300)
At B, its resources are used to produce only capital goods (200)
Points C and D both represent full (efficient) use of an economy's resources, as these points fall on the curve
At C, 150 capital goods and 120 consumer goods are produced
The use of PPC to depict efficiency, inefficiency, attainable and unattainable production
Producing at any point on the curve represents productive efficiency
Any point inside the curve represents inefficiency (point E)
Using the current level of resources available, attainable production is any point on or inside the curve and any point outside the curve is unattainable (point F)

Unlock more, it's free!
Was this revision note helpful?